Axes Scales
Overview
Axis scale allows you to control such features as minimum and maximum scale
values, offsets, scale inversion, intervals, scale type and so on for a single axis. To learn how to create
additional axes - Additional axes. To know how axes display can
be changed - please see: Axes Basics tutorial.
In this section we will explain axis scale options, which are almost the same for all axes.
If you want to control any of scale settings - you should do that in <scale> sub-node of certain axis node.

Scale type
There are two types of scale in AnyChart: "Linear"
and "Logarithmic". To set scale
type specify it in type attribute of <scale> node.
04 |
<scale type="Logarithmic" /> |
07 |
<scale type="Linear" /> |
Note: working with extra axes is explained in Extra Axes Tutorial
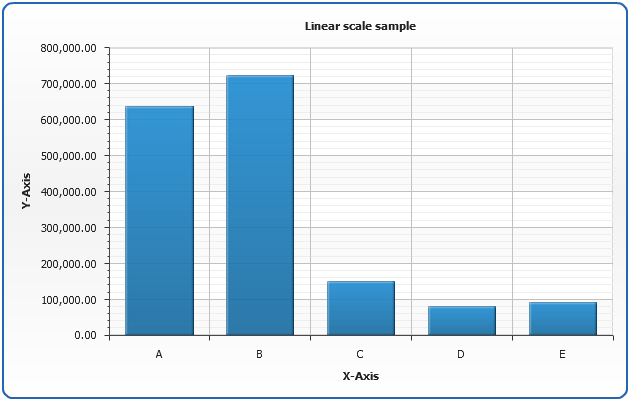
Linear scale
Linear scale type is a default type, values for this scale should be numbers and scale intervals will
be evenly distributed along the axis. This type of scale is used when values fall within one reasonable range.
04 |
<scale type="Linear" /> |
Live Sample: Linear Scale Sample
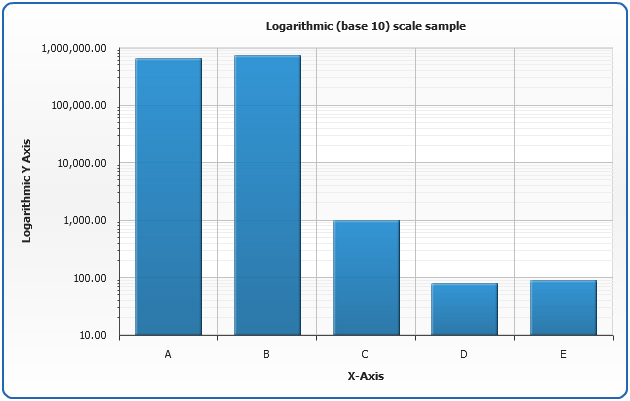
Logarithmic scale
A logarithmic scale is a scale of measurement that uses the logarithm of a physical quantity instead
of the quantity itself. Presentation of data on a logarithmic scale can be helpful when the data covers a large range
of values the logarithm reduces this to a more manageable range. You can set any positive number as a logarithm
base using log_base attribute.
02 |
<scale type="Logarithmic" log_base="10" /> |
In the sample below A = 637.166, B = 721.630,
and C=1.000, D=78, E = 90
Live Sample: Logarithmic Scale Sample
Scale mode
Scale mode defines some additional behavior of an axes. In the table below all modes are listed
and their applicability to different chart types:
| Scale mode |
Charts |
| Normal |
Default for all |
| Stacked |
All ordinal types (Bar, Line, Area, etc.) |
| PercentStacked |
All ordinal types (Bar, Line, Area, etc.) |
| Overlay |
Bar |
| SortedOverlay |
Bar, Bubble |
To change scale mode you need to set "mode" attribute:
02 |
<scale mode="Stacked" /> |
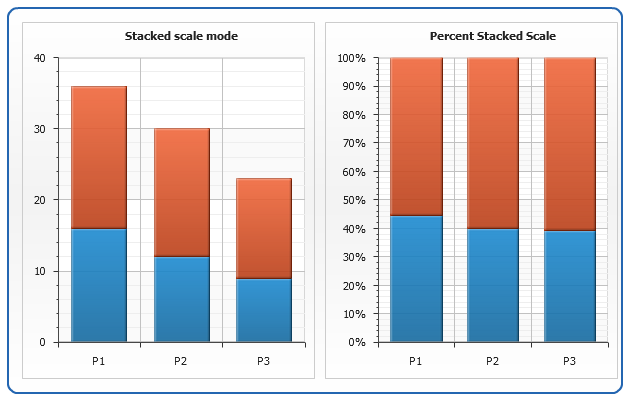
Stacked and Percent Stacked Modes
In the sample below stacked and percent stacked scales are demonstrated on the same data sets:
Live Sample: Stacked and Percent Stacked Scales Sample
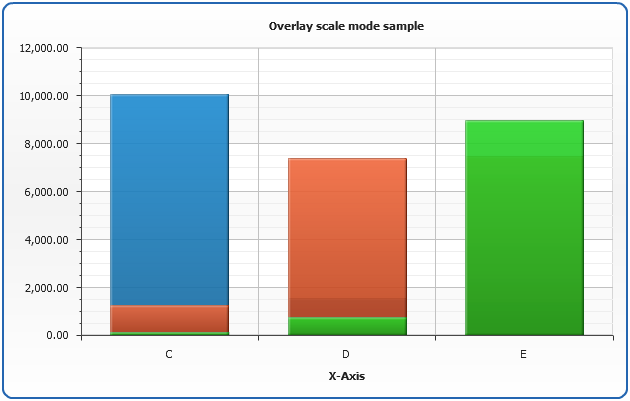
Overlay mode
Overlay mode is intended to show bars one over another:
02 |
<scale mode="Overlay" /> |
With 2D Bars this mode is useful when you know that some series values are higher
that other series values, and you want to make all bars visible. SortedOverlay mode will sort
series and display lower values in front of higher values. On the sample below data set from
the example above is used and all bars are visible:
Live Sample: Overlay Scale Mode Sample
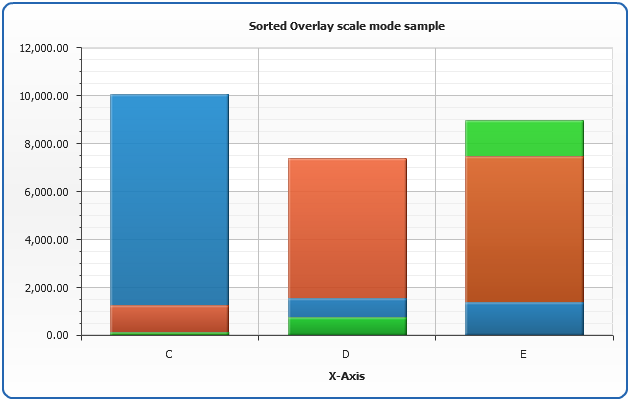
Sorted Overlay mode
Sorted Overlay mode is intended to sort bars and show them one over another:
02 |
<scale mode="SortedOverlay" /> |
With 2D Bars this mode is useful when you know that some series values are higher
that other series values, or when you want to highlight bigger values only. Note: it may look like
stacked, but it is not stacked.
Live Sample: Sorted Overlay Scale Mode Sample
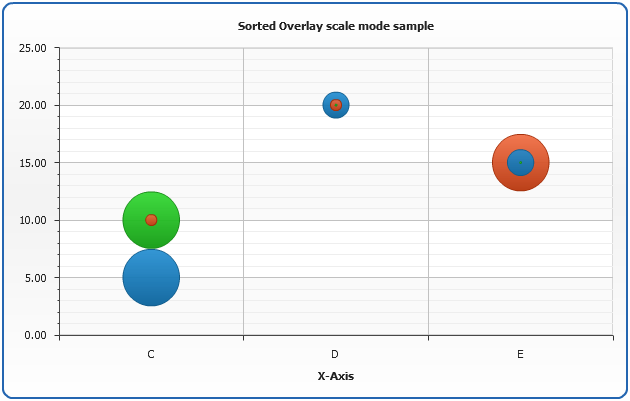
With Bubble chart this mode is useful when you want to be sure that all bubbles are visible.
Live Sample: Sorted Overlay Scale Mode Sample - Bubble chart
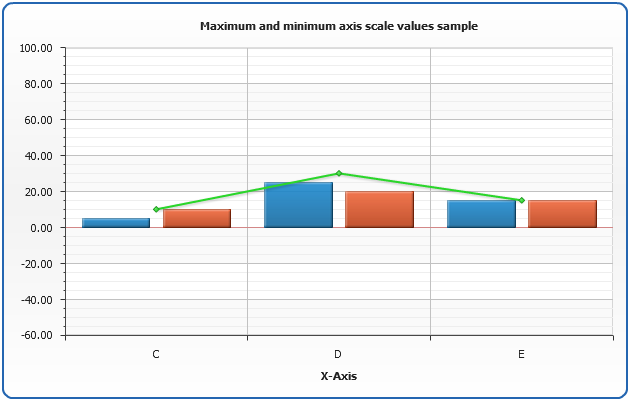
Minimum and Maximum scale values
For any axis scale you can set maximum and/or minimum values, which are calculated automatically
by default.
02 |
<scale maximum="100" minimum="-50" /> |
Not that if will set maximum value lesser than chart elements values,
or minimum bigger than them - these elements will be cut, and you will see only a part
of them or will not see them at all.
Live Sample: Maximum and minumum axis scale values sample
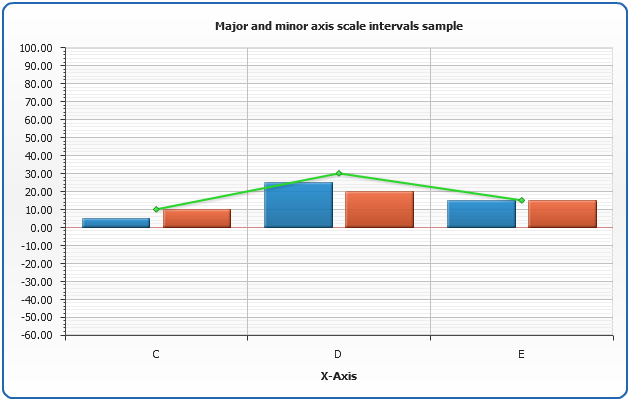
Major and minor intervals
For any axis scale you can set major and minor intervals, which are calculated automatically
by default. Major and minor intervals are axis steps, which define where axis labels (major interval),
axis ticks (major and minor, correspondingly) and major and minor grids are displayed.
02 |
<scale major_interval="20" minor_interval="2" /> |
In the sample below you can see how interval settings affects grids, ticks and labels.
Live Sample: Major and minor axis scale intervals sample
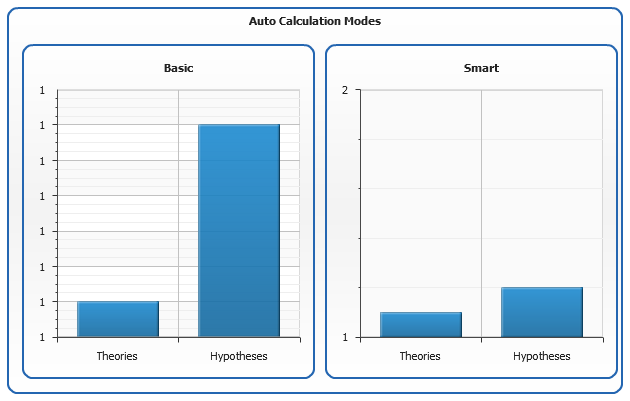
Scale Auto Calculation Modes
If you don't configure steps manually, AnyChart engines steps automatically. There is two step
autocalculation modes: "Basic" (default) and "Smart", which are set using auto_calculation_mode attribute
of scale node.
02 |
<scale auto_calculation_mode="Smart" /> |
Smart mode takes in account the number of decimal digits and allows to avoid situations, when duplicate items
appear on axis scale.
Sample below shows how setting auto calculation mode alters scale:
Live Sample: Auto calculation modes difference sample
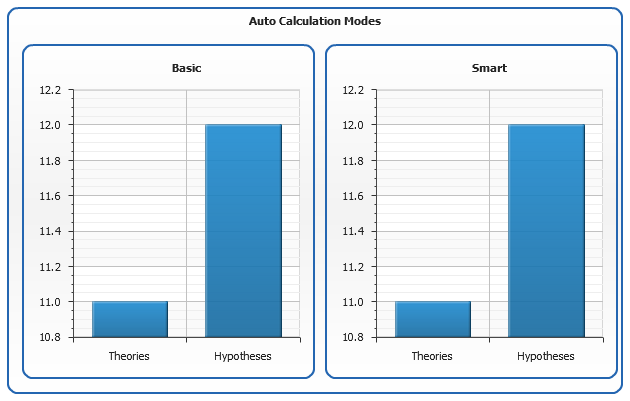
Note, that if there is no need to alter the scale (settings for decimal digits are proper) both modes give the same result:
Live Sample: Auto calculation modes similar sample
Caution: smart calculation mode doesn't help if you use values scaling.
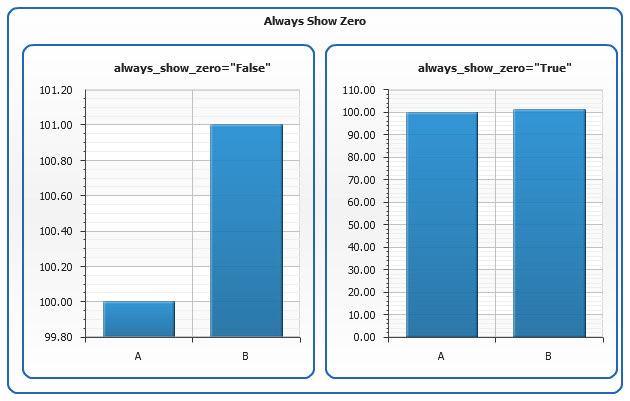
Always Show Zero in Auto Calculation Mode
When scale limits are calculated automatically you may want to enable always_show_zero attribute of the <scale> node, which changes the way limits are calculated: without this attribute engine may move the minimum to some non-zero value to highlight the difference between item. Default value for this attribute is "False".
02 |
<scale always_show_zero="True" /> |
See sample below, two charts contain the same data: two columns with values 100 and 101, in both cases scale is calculated automatically, but in the first user can see the difference better
and in the second case it is easier to compare values.
Live Sample: Auto calculation with and without Always Show Zero
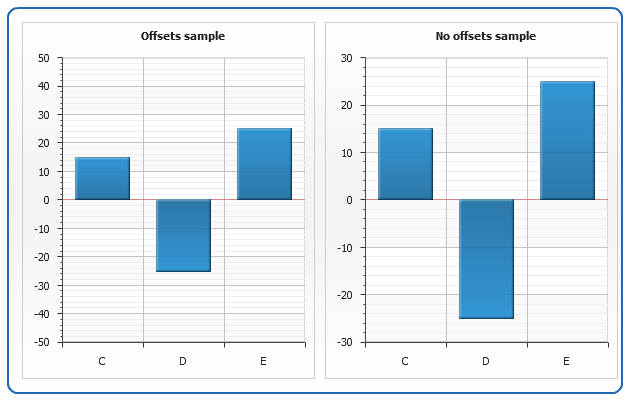
Maximum and minimum offsets
For any axis scale you can set minimum and maximum offsets.
Maximum and minimum offsets are the spacing between maximum or minimum axis
scale values and they are set as a ratio to the maximum and minimum scale
values.
02 |
<scale minimum_offset="0.5" maximum_offset="0.5" /> |
In the sample below you can see how offsets settings affects chart,
the chart to the left has minimum and maximum offsets set to 0.5, the chart to the
right has all the same settings, but offsets are not set. Note that offsets are
ignored when maximum or minimum scale values are specified.
Live Sample: Minimum and maximum axis scale offsets sample
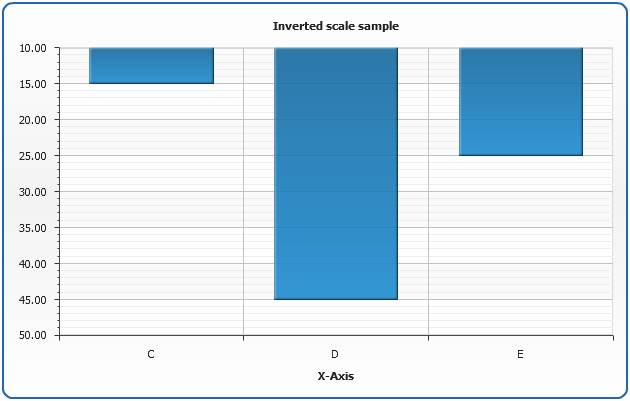
Inverted scale
If you want to display scale in an inverted mode, to
display bigger values to the bottom of the chart - you need to set "inverted"
attribute to "true"
02 |
<scale inverted="true" /> |
Sample inverted scale chart:
Live Sample: Inverted scale sample
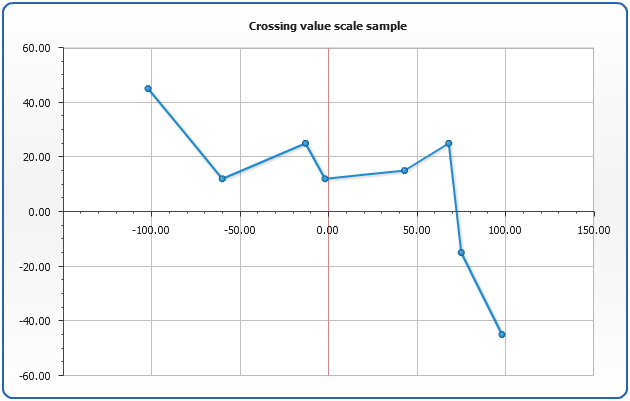
Crossing axis value
If you want to display axis in the center
of the chart you need to set "crossing" value.
This value should be in the range of perpendicular axis.
02 |
<scale crossing="3" /> |
Sample with crossing value set to 3:
Live Sample: Crossing value sample
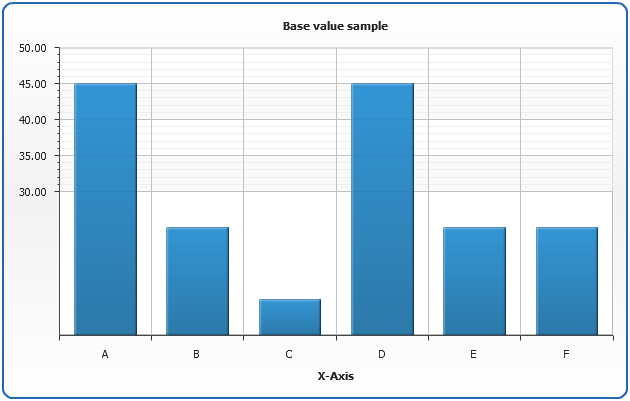
Base axis scale value
Base scale is a value where ticks, grids and labels are starting
to show. Setting base value is useful when you want to ignore some part of
scale range, but do not want to ignore it using minimum value attribute.
02 |
<scale base_value="30" /> |
Sample with base value set to 30:
Live Sample: Base value sample