Spline Area Series
Overview
Data that is arranged in columns or rows on a worksheet can be plotted in an area chart. Spline Area charts emphasize the magnitude of change over time, and can be used to draw attention to the total value across a trend.

Adding Spline Area Series
Before you can add Spline Area series to the chart you need to prepare Data Provider. You need one value to create Spline Area
chart: value. So the Data Provider should contain this field.
Data Provider
Sample XML for Spline Area Data Provider:
As you can see only one value field is defined. Now you can declare series that will use this Data Provider.
Spline Area Series Declaration
XML syntax to declare series with Data Provider shown above:
05 | color: "DarkSeaGreen", |
14 | color: "DarkColor(%Color)", |
Let's put this together and create the very basic Line sample:
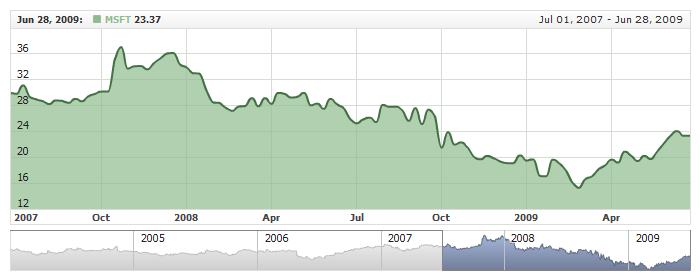
Live Sample: Spline Area Series
Configuring Visualization
All visual and specific settings for Spline Area series are set in <area_series>
in <series> node.
The thickness of top area line is set using thickness attribute in <line> subnode of <area_series>: <line thickness="3"/>, which accepts values in pixels.
The color and opacity of area itself is set in <fill> subnode of <area_series> node: <fill color="%Color" opacity="1"/>
Sample XML with width and and different visualization:
08 | color: "DarkColor(%Color)", |
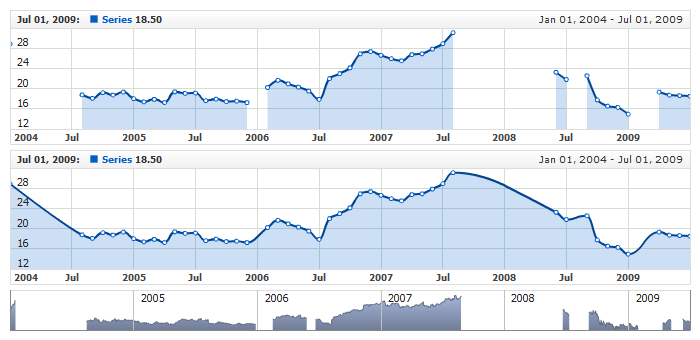
Live Sample below shows to charts with different Spline Area series, each with own specific settings:
Live Sample: Spline Area Series Visual Settings
Legend Element
For each series you can define its element in legend. This element contains the settings for the formatting string of the text in legend that represents the series. Configuration of such elements is described in Legend: Series Labels article.
Tooltips
You can either use global tooltip settings or create personal tooltips for each series. See detailed description in Tooltips tutorial.
Joining Spline Area with Missing Points
Live Sample shows two similar series: one with with connect_missing_points set to true and another - to false.
Live Sample: Spline Area Series - Connect Missing Points Settings
Defaults Section
There is a special section to set default values in AnyChart Stock component XML: <series_settings_defaults>, where you can define marker and value highlighter settings for all series of the given type in one place, instead of setting them for each series individually.
For example, to configure line in one chart for all series of Spline Area type just set:
06 | color: "DarkColor(%Color)", |
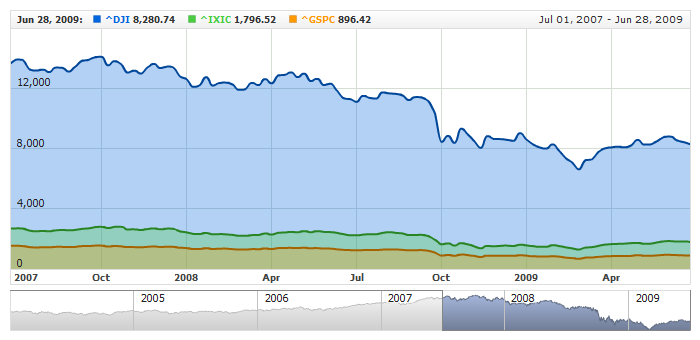
Live sample below has three series of Spline Area type. All common settings defined in <area_series/> node :
Live Sample: Spline Area Series - Using Defaults Section