Defaults Section
Overview
In many situations, several charts may have similar settings for the various elements they contain; these elements may be rather complex, and XML that configures them subsequently may be rather large.
To avoid duplicating similar settings and to make the XML configuration file smaller, you
can take advantage of the Defaults Section, which is shown on the XML listing below:
01 |
<?xml version="1.0" encoding="UTF-8"?> |
02 |
<stock xmlns="http://anychart.com/products/stock/schemas/1.9.0/schema.xsd"> |
In this section, you will learn how to use the defaults section
for different elements; please note that any time you define any settings in
an element - these settings override the defaults.

Default Chart Settings
You can define common chart settings for all charts displayable by the component.
For that purpose, you would need to use the <chart> subnode of
the <defaults> node. Here is a sample XML that shows such node:
01 |
<?xml version="1.0" encoding="UTF-8"?> |
02 |
<stock xmlns="http://anychart.com/products/stock/schemas/1.9.0/schema.xsd"> |
Entire Chart
For example, you may want to turn off the legend background in
all charts. For that purpose, simply make necessary settings in the defaults
node, just as if you were to do that in the chart node. Here is a sample XML
with such settings:
01 |
<?xml version="1.0" encoding="UTF-8"?> |
02 |
<stock xmlns="http://anychart.com/products/stock/schemas/1.9.0/schema.xsd"> |
Besides the legend, you can define all other elements too.
Defining something in the defaults section is the same as defining the same in all charts at once.
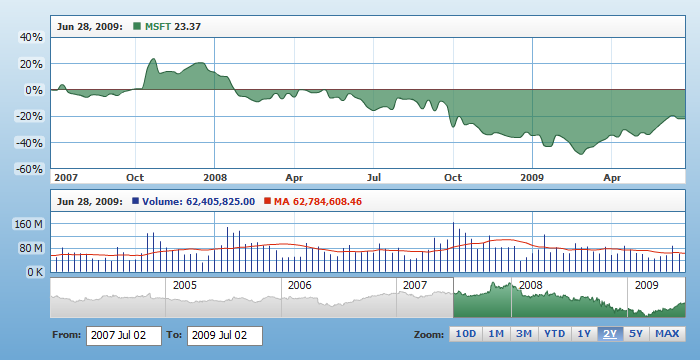
The example below demonstrates the definition of a chart background, axes settings, legend settings
and so on in the defaults section and shows two charts with those definitions
applied. Take a note that the value axes have different formats (the lower chart uses scaling) although
the labels format is defined in the defaults; that is so because the lower chart
defines its own label format, which overrides the default one:
Live Sample: Defaults for Entire Chart
To configure your charts properly, please refer to:
Default Series Settings
Series settings can be very large, as they define what the lines, area and bars
should look like; they contain tooltip configuration options and much more.
Besides that, sometimes one chart may have only a line type series, while the
other may also have bars; you may want to keep them both in one place in XML -
to make it easier to modify them. All that can be done in the series section defaults.
Here is a sample XML that defines all those line type series:
01 |
<?xml version="1.0" encoding="UTF-8"?> |
02 |
<stock xmlns="http://anychart.com/products/stock/schemas/1.9.0/schema.xsd"> |
The Live Sample below shows how even very complex tooltip settings
can be applied to all line charts at once:
Live Sample: Defaults Section - Series Settings Defaults
To configure series properly, please refer to:
Default Technical Indicator Settings
Technical indicators settings are pretty similar to series settings, and
their defaults are defined pretty much the same way.
Here is a sample XML that defines line thickness for all SMA indicators:
01 |
<?xml version="1.0" encoding="UTF-8"?> |
02 |
<stock xmlns="http://anychart.com/products/stock/schemas/1.9.0/schema.xsd"> |
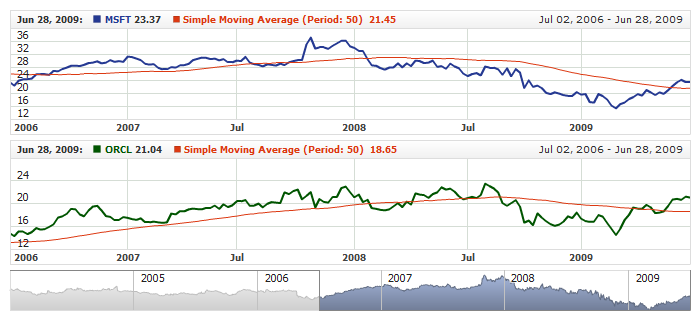
The Live Sample below demonstrates setting the default name, period,
and color for all SMA indicators to be shown; the only things defined in the charts
are data provider and type:
Live Sample: Defaults Section - Technical Indicators Settings Defaults
To configure technical indicators properly, please refer to:
Default Custom Label Settings
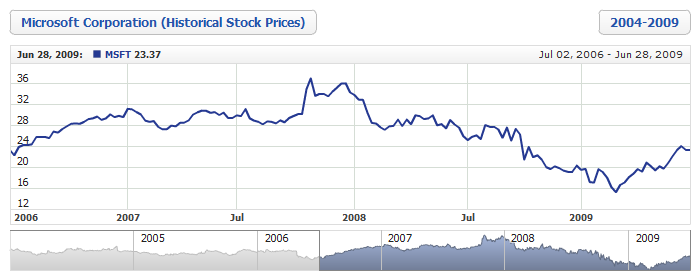
If your chart uses a lot of extra labels, and you want to give them
all a similar look, you can take advantage of the defaults set for the labels section.
This sample XML syntax defines complex background and font settings for all labels:
01 |
<?xml version="1.0" encoding="UTF-8"?> |
02 |
<stock xmlns="http://anychart.com/products/stock/schemas/1.9.0/schema.xsd"> |
And the Live Sample below demonstrates how these settings work:
Live Sample: Defaults Section - Inividual Charts Labels Settings Defaults
To configure labels properly, please refer to: