X-Axis Markers
Overview
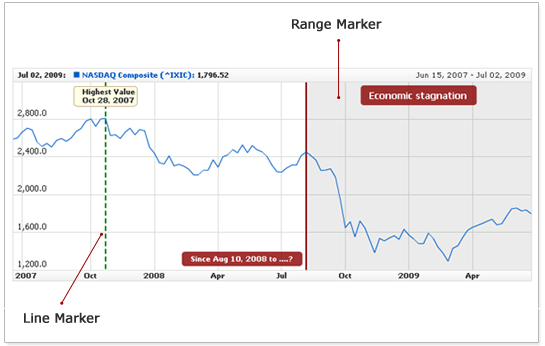
AnyChart Stock supports "Axis Markers", which allow showing trends, limits, highlighting date time intervals of interest and other important information.
The current version supports two types of markers:
- Line Marker - a vertical line bound to some timestamp on the axis.
- Range Marker - is bound to two timestamps and allows defining a line for each timestamp and and a custom filler between those lines.
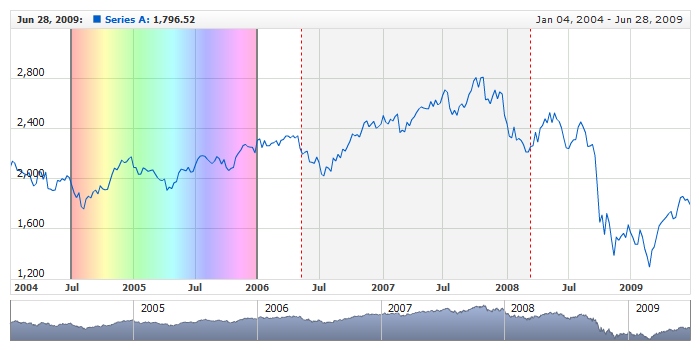
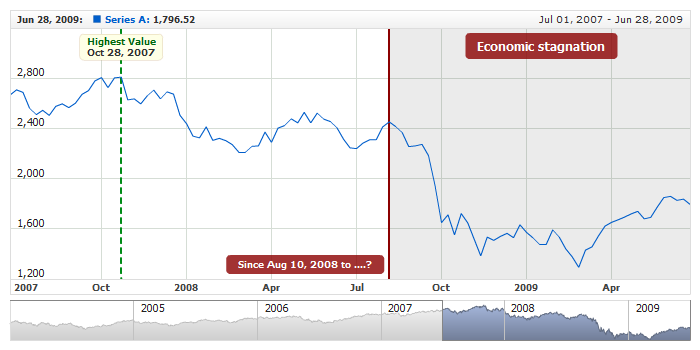
Any marker can have several labels positioned by the axis marker. The illustration below demonstrates the both marker types:
Axis Markers are bound to the dates axis; you can add any number of the markers to a chart to be displayed.
Here is a sample XML that shows where the marker configuration parameters are to be placed:
As you can see in the sample, line markers are defined in the <line_marker> node, and Range Markers - in the <range_marker> node.

Line Markers
A line marker displays one date on the axis in the form of a line and/or a set of labels.
Adding Line Markers
When creating a line marker, you should specify one exact date on the axis. The number of markers is not limited, and they all are defined with a list of the <line_marker> nodes.
This sample XML demonstrates the definition of three line markers:
date attribute set axis marker position. This date should follow formatting rules described in Input Date-Time Format article.
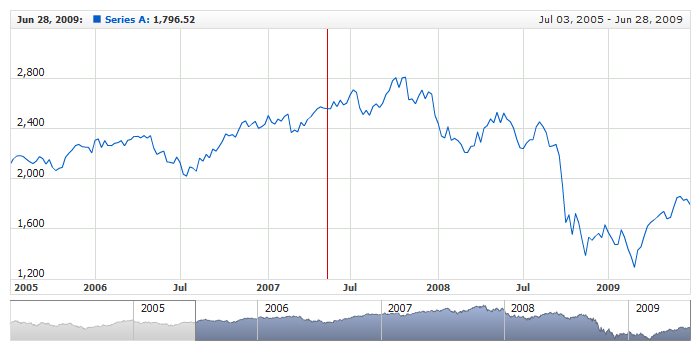
The live sample below demonstrates a line marker in action:
Live Sample: X-Axis Markers - Line Marker
Line Settings
A line marker can be drawn as solid or dashed line. The sample XML below demonstrates them both:
As you can see in the sample, the line is configured in the <line> subnode. To make the line dashed, you are to set the dashed attribute to true and (optionally) define the dash_length and dash_space.
The live sample below demonstrates the above configuration in action:
Live Sample: X-Axis Markers - Line Settings
Learn more about line settings for line markers in XML Reference.
Labels
An axis marker can have an unlimited number of labels - depending on your task, you can add one, two, three or more labels placed in different areas, with different text and appearance.
Labels are defined by the set of the <label> nodes. For example:
Below follows the description of label configuration.
Positioning
A label can be placed on any position relative to the marker line inside the data plotting area. Be default, labels are placed to the right of the marker line at the top of the chart.
The following attributes of the <label> node are used for defining label position:
| Attribute |
Possible Values |
Description |
| anchor |
Top
Center
Bottom
|
Sets label anchor. |
| valign |
Top
Center
Bottom |
Sets label vertical alignment. |
| halign |
Left
Center
Right |
Sets label horizontal alignment. |
| x_padding |
Any number |
Sets label X padding. |
| y_padding |
Any number |
Sets label Y padding. |
Here is a sample XML that demonstrates defining a label position:
Text and Tokens
To define a label text, use the <format> node, you can use either a static text or a {%Date} token, which would be replaced with the actual value set in the date attribute of <line_marker> node.
Here is a sample XML that shows how to define a label text:
With this formatting, the label would display the following text: "Date: 2009-03-03". The {%Date} token can be formatted just as any other token - see Date-Time Formatting for more information.
Font
Label font is configured in the typical <font> node.
There are two major options for configuring label font:
- Apply same font for entire text with the <font> node .
- Use HTML formatting. To do this, you are to include the <font render_as_html="true"/> line in the configuration.
This XML sample demonstrates how to define font settings with the <font> node:
Another example - doing the same with the HTML tag:
05 |
<format><![CDATA[Date: <b><font color="#883333">{%Date}</font></b>]]></format> |
08 | format: "Date: <b><font color=\"#883333\">{%Date}</font></b>" |
Find out more about font settings and HTML formatting in Font Configuration.
Background
You can enable background to make the text in a label easier to read. Background is configured in the <background> node.
The sample XML below demonstrates how to define label background:
Sample with All Settings
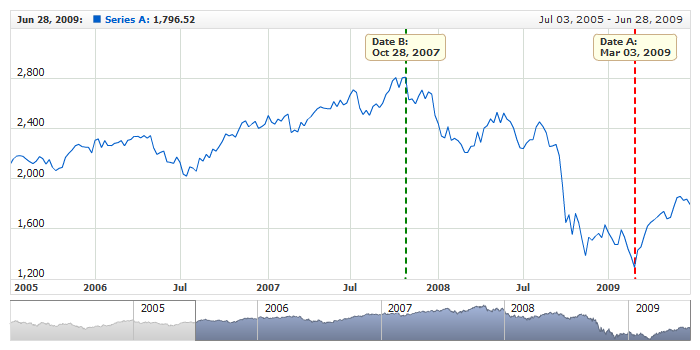
Take a look at the sample below that uses all the settings described above, including HTML text formatting:
Live Sample: X-Axis Markers - Line Marker with Labels
Range Markers
A range marker is bound to two axis dates: start and end. It appears as two lines and a filler between them. Just as line marker, range marker can have an unlimited number of labels, but these labels have more anchors.
Adding Range Markers
When adding a range marker, you should define the limits that you want to show on the plot. The number of markers is not limited, and they all are defined in the list of the <range_marker> nodes .
This sample XML demonstrates adding three range markers to the primary axis:
01 |
<?xml version="1.0" encoding="UTF-8"?> |
02 |
<stock xmlns="http://anychart.com/products/stock/schemas/1.9.0/schema.xsd"> |
As you can see here, the limits of the range are set by the start_date and end_date attributes. These dates should follow formatting rules described in Input Date-Time Format article.
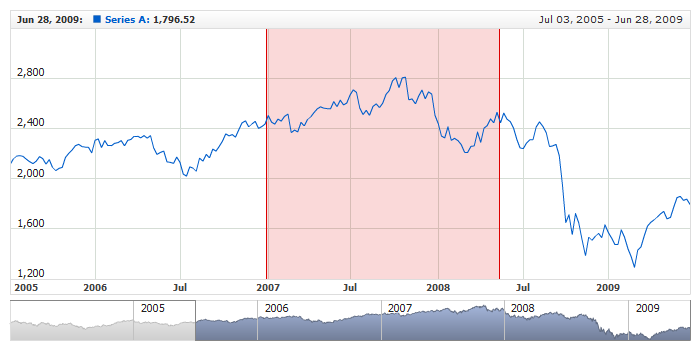
Here is a live sample for a range marker between "2007-01-02" and "2008-05-15:
Live Sample: X-Axis Markers - Range Marker
This is what a range marker looks like by default; you can tune up the visual settings to customize its appearance. The customization is going to be covered right next.
Visual Settings
A range marker consists of three elements:
- Start range line
- End range line
- Range filler
The lines can be either solid or dashed; the filler can be solid or gradient. The sample XML below demonstrates how to configure the appearance of a range marker:
The live sample below demonstrates two range markers with configured visual settings:
Live Sample: X-Axis Markers - Range Marker Visual Settings
Find out more about fill configuration in Background Tutorial and XML Reference.
Using Labels
An axis marker can have an unlimited number of labels - depending on your task, you can add one, two, three or more labels placed in different areas, with different text and appearance.
Labels are defined by the set of the <label> nodes. For example:
04 |
<format><![CDATA[{%StartDate}{"%MMM %dd, %yyyy"} - {%EndDate}{"%MMM %dd, %yyyy"}]]></format> |
10 | format: "{%StartDate}{\"%MMM %dd, %yyyy\"} - {%EndDate}{\"%MMM %dd, %yyyy\"}", |
Below follows the description of label customization.
Positioning
A label can be placed on any position relative to the marker line inside the data plotting area. Be default, labels are placed in the center-right of the plotting area.
The following attributes of the <label> node are used for defining label position:
| Attribute |
Possible Values |
Description |
| anchor |
LeftTop
RightTop
LeftBottom
RightBottom
LeftCenter
RightCenter
TopCenter
BottomCenter
Center
|
Sets label anchor. |
| valign |
Top
Center
Bottom |
Sets label vertical alignment. |
| halign |
Left
Center
Right |
Sets label horizontal alignment. |
| x_padding |
Any number |
Sets label X padding. |
| y_padding |
Any number |
Sets label Y padding. |
Here is a sample XML that demonstrates defining a label position:
With such settings label is placed in the top right corner of the area.
Text and Tokens
To define a label text, use the <format> node, you can use either a static text or the {%StartDate} and {%EndDate} tokens, which would be replaced with the actual value set in the start_date and end_date attributes of the <range_marker> node.
Here is a sample XML that shows how to define a label text:
04 |
<format><![CDATA[Range: {%StartDate} - {%EndDate}]]></format> |
06 | format: "Range: {%StartDate} - {%EndDate}" |
With this formatting, the label would display the following text: "Range: 2008-08-10 - 2009-07-02". The {%StartDate} and {%EndDate} tokens can be formatted just as any other token - see Date-Time Formatting for more information.
Font
Label font is configured in the typical <font> node.
There are two major options for configuring label font:
- Apply same font for entire text with the <font> node .
- Use HTML formatting. To do this, you are to include the <font render_as_html="true"/> line in the configuration.
This XML sample demonstrates defining font settings with the <font> node:
Another example - doing the same with the HTML tag:
05 |
<format><![CDATA[<b><font color="#883333">{%StartDate} - {%EndDate}</font></b>]]></format> |
09 | format: "<b><font color=\"#883333\">{%StartDate} - {%EndDate}</font></b>" |
Find out more about font settings and HTML formatting in Font Configuration.
Background
You can enable background to make the text in a label easier to read. Background is configured in the <background> node.
The sample XML below demonstrates how to define label background:
04 |
<format><![CDATA[Range: {%StartDate} - {%EndDate}]]></format> |
11 | format: "Range: {%StartDate} - {%EndDate}", |
Sample with All Settings
Take a look at the sample below that uses all the settings described above, including HTML text formatting:
Live Sample: X-Axis Markers - Range Maerker with Labels
Default Settings
If you use a lot of line or range markers with identical visual or label settings, it is better to use default settings to avoid settings duplication.
You can set default settings for all axis markers of X axis in:
- <line_marker_defaults> - for line markers,
- <range_marker_defaults> - for range markers.
Sample XML below shows how to set defaults for all markers:
62 | format: "{%StartDate} - {%EndDate}", |
Live sample below shows how defaults for axis markers can be set and how certain marker settings can be reset:
Live Sample: X-Axis Markers - Using Defaults