Multiple Legends
Overview
AnyChart allows to add as many legends to your chart as you need. Multiple Legends are useful when you want to divide some data into different legends, for example one legend can show the list of series, another - list of series point or threshold.
This article shows only simple legends positioning - if you need complex one, please study Controls and Controls Positioning.
General legend settings and configuration is described in Legend Tutorial.

Chart with Multiple Legends
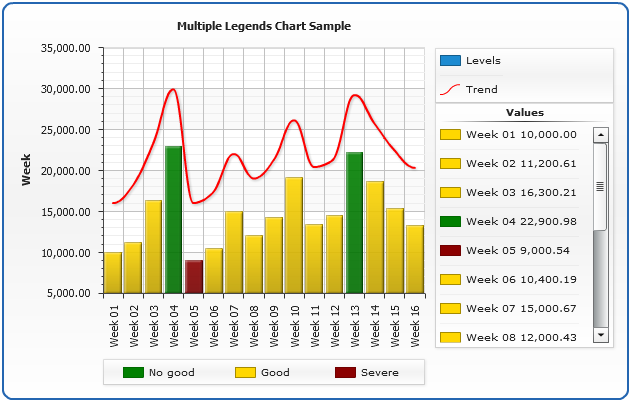
The sample chart below contains series of column and line type, columns are colored using custom threshold.
We will add three legends to the chart - main will show series list, second - points from column series and third will display threshold with colors explanation.
Additional legend is set in <controls> node in <chart_settings>:
02 |
<legend enabled="true" ignore_auto_item="True" position="Right" align="Near" align_by="dataplot" columns="1" width="30%" horizontal_padding="0"> |
03 |
<title enabled="true"> |
04 |
<text><![CDATA[Values]]></text> |
06 |
<columns_separator enabled="false" /> |
08 |
<item source="points" series="Levels"> |
09 |
<text><![CDATA[{%Icon} {%Name} {%Value}]]></text> |
So, the additional legend shows "Column" series (note items settings: <item source="points" series="Levels">) and placed below the main one.
The second additional legend displays threshold with descriptions, descriptions are set as the custom attributes of thresholds conditions. This legend is placed to the bottom of the chart.
01 |
<legend enabled="true" ignore_auto_item="True" position="Bottom" align="Spread" align_by="dataplot" rows="1"> |
02 |
<title enabled="true"> |
03 |
<text><![CDATA[Values]]></text> |
05 |
<columns_separator enabled="false" /> |
07 |
<item source="thresholds" threshold="thrLevels"> |
08 |
<text><![CDATA[{%Icon} {%ConditionDescription}]]></text> |
That's it - we just populated a chart with data, described threshold and a sample chart with multiple legends is ready:
Live Sample: Sample Multiple Legends Column Chart
Map with Multiple Legends
Sample map with multiple legends can be found in Legend in Map Article.