Zooming and Scrolling
Overview
All X / Y Axes based charts (Bar, Line, Area, Candlestick, OHLC, Combinations, etc.) can have Axes with scroll bar. Robust, configurable scroll controls with the ability of external JS or Flex control.
There are two notes aboutr the current version: 3D charts and Logarithmic Axes can't be scrollable.
![]()
Turning Zoom and Scroll On/Off
Scroll is controlled for each axis in <zoom> node:

01 |
<axes> |
02 |
<scroll_bar_settings> |
03 |
<vert_scroll_bar /> |
04 |
<horz_scroll_bar /> |
05 |
</scroll_bar_settings> |
06 |
<y_axis> |
07 |
<zoom enabled="" show_scroll_bar="" start="" end="" visible_range="" visible_range_unit="" /> |
08 |
</y_axis> |
09 |
<x_axis> |
10 |
<zoom /> |
11 |
</x_axis> |
12 |
</axes> |
All these attrubutes are not used together, the set differs for Categorized Charts, for Linear Axes and Datetime axes.
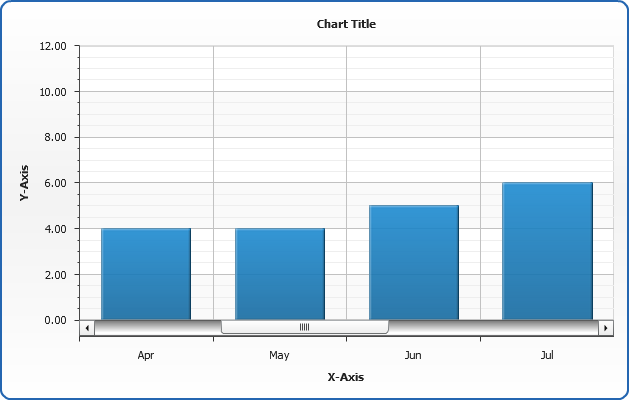
Categorized axis
For categorized charts you can set the starting index and either number of categories to show, or the ending category:
01 |
<x_axis> |
02 |
<zoom enabled="true" inside="true" start="2.5" visible_range="4" /> |
03 |
</x_axis> |
This is a sample of bar chart with such settings:
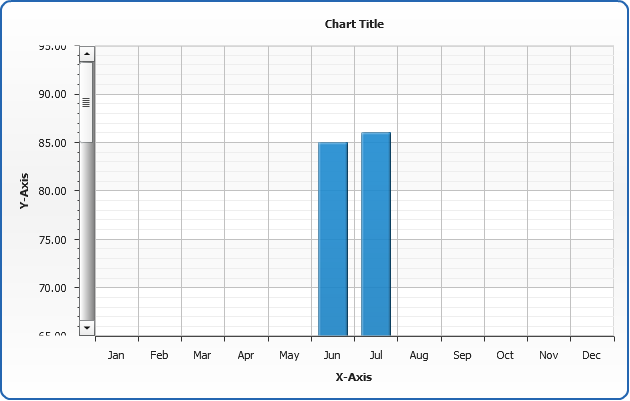
Linear Axes
For linear axes you can set the starting value and either the range to show or ending value:
01 |
<y_axis> |
02 |
<zoom enabled="true" inside="true" start="65" end="95" /> |
03 |
</y_axis> |
This is a sample of bar chart and Y Axis scrollable with such settings:
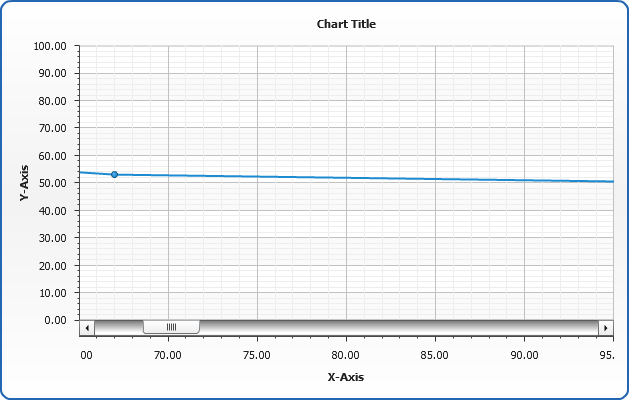
And this is a sample of scatter X/Y line with X Axis made scrollable:
01 |
<x_axis> |
02 |
<zoom enabled="true" inside="true" start="65" end="95" /> |
03 |
</x_axis> |
Live sample:
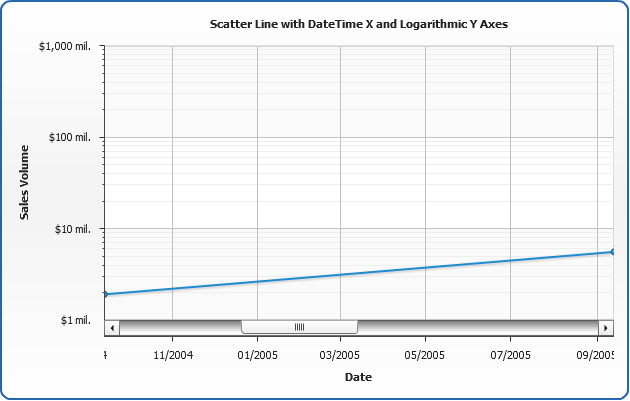
Date Time Axes
For Date Time axes you can also set start date and end date, but when you define a range you should specify what units are used:
01 |
<x_axis> |
02 |
<zoom enabled="true" start="1095048000" visible_range="1" visible_range_unit="Year" /> |
03 |
</x_axis> |
This is a sample of line chart with such settings:
![]()
JS Control
Set Scroll State Methods
You can control zoom and scroll using setXZoom and setYZoom JS Functions from JS Library. These functions have the differ use depending on the type of chart and axis, see available options and samples below.
Categorized Charts
Range in XML
01 |
<zoom enabled="true" start="Jan" visible_range="10" /> |
Range in JS
Start End in XML
01 |
<zoom enabled="true" start="Jan" end="Feb" /> |
Start End in JS
Scatter Plot Charts with Number Axis
Start Range in XML
01 |
<zoom enabled="true" start="1000" visible_range="100" /> |
Start Range in JS
Start End in XML
01 |
<zoom enabled="true" start="1000" end="1100" /> |
Start End in JS
Scatter Plot Charts with Date Time Axis
start range in XML
01 |
<zoom enabled="true" start="1995/11/10" visible_range="10" visible_range_unit="Month" /> |
start range in js
start end in XML
01 |
<zoom enabled="true" start="1995/11/10" end="1996/11/10" /> |
start end in js
Also there are three similar methods: setViewXZoom(viewName, settings), setViewYZoom(viewName, settings) and setViewZoom(viewName, settings) for setting zoom in views.
![]()
Scroll To Methods
If you'd like to
![]()
Get Scroll State Methods
To obtain the state of the scroll bar when needed you can use getXScrollInfo or getYScrollInfo methods. They provide you an access to an object with the following structure:
| Field | Value |
|---|---|
| Start | Number |
| Range | Number |
Initiate these method when you need in order to obtain the info:
infoY = chart.getYScrollInfo();
Also there are two similar methods: getViewXScrollInfo(viewName) and getViewYScrollInfo(viewName), that allow to get scroll states from dashboard views.
![]()
Scroll State Events
To track the current state of scroll you shoud use XAxisScrollChange and/or YAxisScrollChange events, in these events you can obtain the standart scroll data and phase and process enums, which allow to define the source of scroll:
| Field | Possible Values |
|---|---|
| startValue | Number |
| endValue | Number |
| range | Number |
| phase | start progress process end |
| process | plotDrag scrollBar |
Setting event handlers can be attached separately to Y and X axes and should be done like that:
chart.addEventListener("YAxisScrollChange", yAxisChange);
![]()
Actions
You can control zoom and scroll using AnyChart Actions. See Actions article for more.
![]()