Working with background
- Overview
- Border Settings
- Fill Settings
- Hatch-Fill Settings
- Corners Settings
- Inside Margins Settings
- Using Effects
Overview
In this tutorial we will explain in details how to configure background in AnyChart.
Background consists of fill, border, hatch fill, border corners and inside margins. These element are configured using <fill>, <border>, <hatch_ fill>, <corners> and <inside_margins> nodes, respectively. Also, effects can be applied to the whole background.
Background is used in chart titles, labels, tooltips, chart background, data plot, and many more, but they are configured the same way.
Below you will find the reference of most important attributes of the mentioned nodes and see the demonstration of theirs settings.
![]()
Border Settings
Border is configured using <border> node. Border can be of "Solid" and "Gradient" type. If type is "Solid", then color is specified using color attribute; to configure "Gradient" you have to add <gradient> node and specify the required number of gradient keys.
Typical solid border settings look like:

01 |
<border enabled="True" thickness="1" type="Solid" color="Black" opacity="0.5" /> |
Typical gradient border settings look like:
01 |
<border enabled="True" thickness="2" type="Gradient"> |
02 |
<gradient type="Linear"> |
03 |
<key position="0" color="Green" opacity="0.5" /> |
04 |
<key position="1" color="Blue" opacity="1" /> |
05 |
</gradient> |
06 |
</border> |
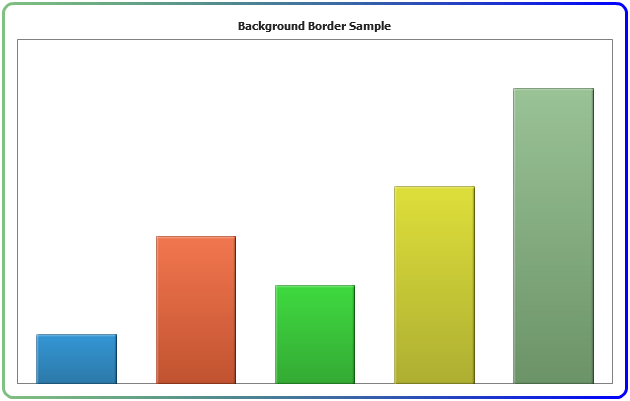
On the chart below typical solid border settings are applied to data plot background and typical gradient border is set to chart background. Application is made like that:
01 |
<chart_settings> |
02 |
<chart_background> |
03 |
<border enabled="True" thickness="2" type="Gradient"> |
04 |
<gradient type="Linear"> |
05 |
<key position="0" color="Green" opacity="0.5" /> |
06 |
<key position="1" color="Blue" opacity="1" /> |
07 |
</gradient> |
08 |
</border> |
09 |
</chart_background> |
10 |
<data_plot_background> |
11 |
<border enabled="True" thickness="1" type="Solid" color="Black" opacity="0.5" /> |
12 |
</data_plot_background> |
13 |
</chart_settings> |
![]()
Fill Settings
With AnyChart you it is possible to color background with a solid color, with a gradient transition or fill it with an image. Fill is configured in the <fill> node and depending on the type it has different settings. Note that hatch fill is not a fill type - it is a separate entity and can be combined with any fill type.
![]()
Solid Fill
When fill type is set to "Solid", background is filled with one color and you can control this color opacity. Colors can be defined with any of the methods described in Color management tutorial. Typical solid fill settings are:
01 |
<fill type="Solid" color="RoyalBlue" opacity="0.5" /> |
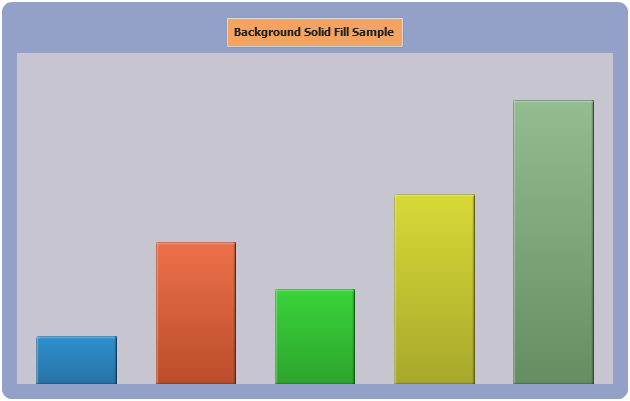
In the sample below chart, data plot and chart title backgrounds are colored with a solid fill:
![]()
Gradient Fill
AnyChart allows to create Gradient fills for any background. To create gradient fill you need to set type="Gradient" and configure gradient settings in <gradient> sub-node.
There are two types of gradient fills - "Linear" and "Radial"
Typical gradient border settings look like:
01 |
<fill enabled="True" type="Gradient"> |
02 |
<gradient type="Linear"> |
03 |
<key position="0" color="Green" opacity="0.5" /> |
04 |
<key position="1" color="Blue" opacity="1" /> |
05 |
</gradient> |
06 |
</fill> |
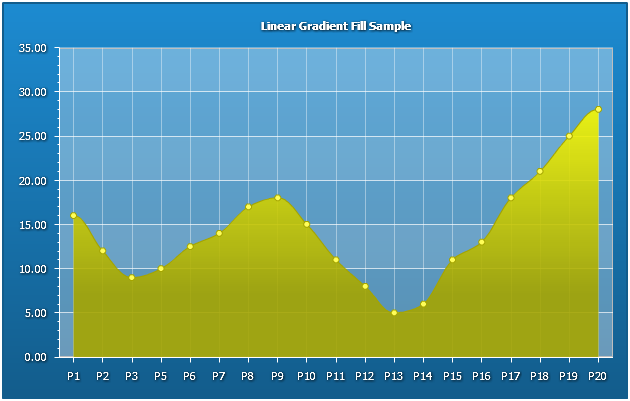
The sample below demonstrates how gradient fill can be used to create really attractive area chart, if you will take a closer look at this chart configuration XML you will see that sometimes color is defined as "DarkColor(#1D8BD1)" or "DarkColor(%Color)" - these are color transformation functions and color parameters, to understand what they are and how they can be used please refer to Color management tutorial.
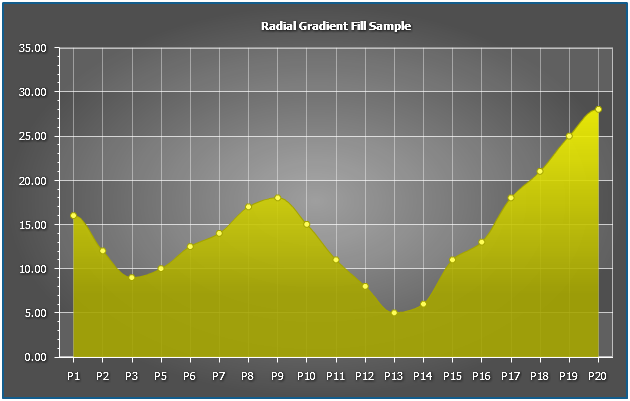
The same sample, but with radial gradient fill:
![]()
Image Fill
Image fill allows you to set an image as a background, an image can be stretched, tiled or fit by proportions. Supported image formats are JPEG, GIF, PNG.
Typical image background settings are:
01 |
<fill enabled="True" type="Image" image_url="sample.jpg" image_mode="Tile" /> |
In the sample below chart background is filled with a JPEG image:

![]()
Resources Path
By the way: you can configure path for loading external resources - like images. In the sample above we've set:
01 |
<?xml version="1.0" encoding="UTF-8"?> |
02 |
<anychart> |
03 |
<settings> |
04 |
<resources path="../img/" path_type="relativeToSWF" /> |
05 |
</settings> |
06 |
</anychart> |
This way we've told AnyChart where it should look for images and were able to set only: image_url="image_fill.jpg" in image fill settings. Path type can be: "RelativeToHTML", "RelativeToSWF", "Absolute".
![]()
Hatch-Fill Settings
Hatch fill covers background with the given repeating pattern of the defined size, these fills are extremely useful for black and white printing and for those who are color-blind.
01 |
<hatch_fill enabled="True" type="Confetti" pattern_size="5" color="Black" thickness="1" /> |
In the sample below chart and data plot backgrounds are filled with the different hatch fills:
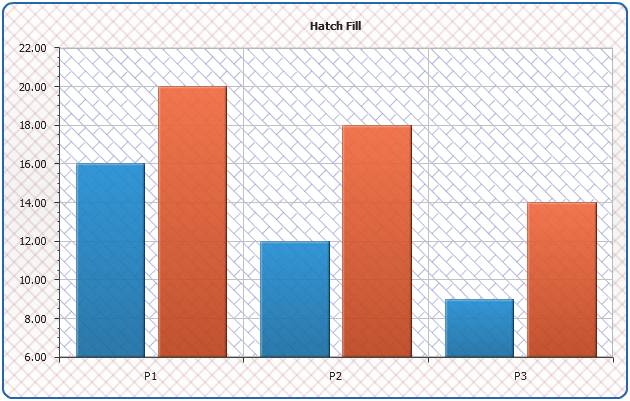
![]()
Corners Settings
You can adjust the shape of borders corners, there are 4 types for corners: "Square", "Rounded", "Cut" and "RoundedInner". Appearance of these types is shown on the image below:
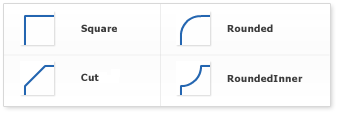
For "Rounded", "Cut" and "RoundedInner" types you can control not only a shape, but also a radius of "rounding" or "cutting" for all corners, or given corners.
Typical settings for "rounding" all corners are:
01 |
<corners type="Rounded" all="10" /> |
To set only left top corner shape to "Cut" type settings like this should be used:
01 |
<corners type="Cut" all="0" left_top="10" /> |
The dashboard below demonstrates all possible corners types:
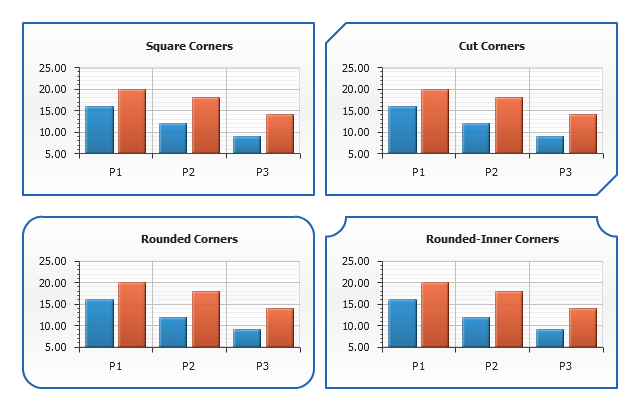
![]()
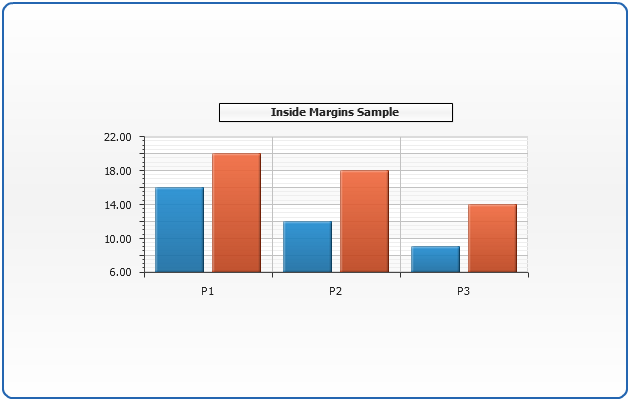
Inside margins
If you want to increase or decrease the spaces between border and background content (texts, chart, etc.) you can do that setting inside margins. Margins are measured in pixels. Every side margin can be set individually, "all" attribute is used to set them all together. Note that every individual settings override "all" value.
Typical settings for inside margins are:
01 |
<inside_margin left="5" top="5" right="5" bottom="5" all="10" /> |
In the sample below we will adjust margins for chart title and for chart itself.
![]()
Using Effects
You can apply one or several effects to background, to that you should specify <effects> node and add required effects sub-nodes. To learn more about effects, please refer to Using Effects Tutorial .
Typical effects settings are:
01 |
<effects> |
02 |
<glow enabled="true" color="Red" blur_x="20" blur_y="20" opacity="0.5" /> |
03 |
<drop_shadow enabled="true" /> |
04 |
</effects> |
Below you can see a sample of glow effect application to chart background.
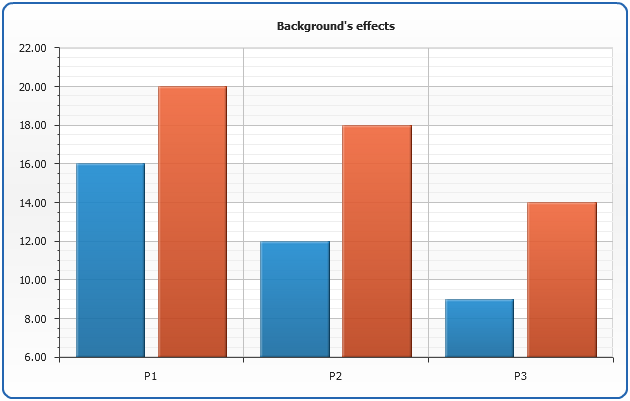
![]()