Color Management
Overview
AnyChart allows you to set color of any element of the chart, and moreover - it provides a very user/designer/developer friendly mechanism of color setting. Web-developers usually work with Hexadecimal or Web-Colors, desktop developer use RGB or HSB notation. AnyChart supports all this formats and gives user the way for built-in color transformation.

Color Formats
As it was said above AnyChart supports the following color setting notation, which means - you can use any of them when setting a value of color attribute in any node:
- Hexadecimal (html-like)
- Red Green Blue
- Hue Saturation Brightness
- Web-Color Constants
Hexadecimal
Hexadecimal notation is widely used in HTML. A hex triplet is a six-digit, three-byte hexadecimal number used in HTML and CSS, and other computing applications, to represent colors. The bytes represent the red, green and blue components of the color. One byte represents a number in the range 00 to FF (in hexadecimal notation). This represents the least (0) to the most (255) intensity of each of the color components. The hex triplet is formed by concatenating three bytes in hexadecimal notation, in the following order:
red value; green value; blue value.
When setting color using Hexadecimal notation you should use "#" before hex constant itself, for example, to set font color to blue you should specify:
01 |
<font color="#0000FF" /> |
RGB Macro
This format, just as Hexadecimal, sets color using three components: red, green and blue, but uses decimal, not hexadecimal values, for example: RGB(255,255,0) stands for absolutely Yellow. The syntax: RGB(red,green,blue), where red, green and blue – decimal values, that vary from 0 to 255.
01 |
<font color="RGB(0,0,255)" /> |
HSB Macro
HSB sets color in Hue-Saturation-Brightness color space. Syntax: HSB(hue,saturation,brightness), where hue – varies from 0 to 360, saturation – from 0 to 100, and brightness - 0 to 100. Sample colors: HSB(0,100,100) – Red color, HSB(60,100,100) – yellow color, HSB(0,0,100) – white, etc.
01 |
<font color="HSB(240,100,50)" /> |
Web-Colors
Also you can use Web-Color constants. For example: "Red", "Gold", "RoyalBlue", etc. Table with full list of color constants, along with their hexadecimal, RGB and HSB you can find on Web-Color Constants Table.
Color Transformation
To make design easier - AnyChart Provides several color transformation functions, below you will find their reference and a sample of their usage in creation of you own style for Column charts.
| Function |
Description |
| LightColor(Color) |
Returns Lighter color than given |
| DarkColor(Color) |
Returns Darker color than given |
| Blend(Color1, Color2, Ratio) |
Blend two colors with a given Ratio |
LightColor
LightColor function is used to return for sure a color that is lighter than a given, for example, if input color is Black - we will get some non-black color, that can be used for highlighting element. Input color can be specified in any of the specified above.
Sample: LightColor(Red) = LightColor(RGB(255,0,0)) = LightColor(#FF0000) = #FF5959
| Input color |
LightColor |
| #FF0000 |
|
#FF5959 |
|
DarkColor
(Red) = a50000
DarkColor function is used to return for sure a color that is darker than a given, for example, if input color is White - we will get some non-white color, that can be used for outlining an element. Input color can be specified in any of the specified above.
Sample: DarkColor(Red) = DarkColor(RGB(255,0,0)) = DarkColor(#FF0000) = #A50000
| Input color |
DarkColor |
| #FF0000 |
|
#A50000 |
|
Blend
Blend function allows you to mix two colors with a given ratio, it gives even wider control over getting a right tone.
Sample: Blend(Red, Green, 0.5) = #7F4000
| Input color |
Blend color |
Ratio |
Result Color |
| #FF0000 |
|
#008000 |
|
0 (full mixture) |
#008000 |
|
| #FF0000 |
|
#008000 |
|
0.5 |
#7F4000 |
|
| #FF0000 |
|
#008000 |
|
1 (no mixture) |
#FF0000 |
|
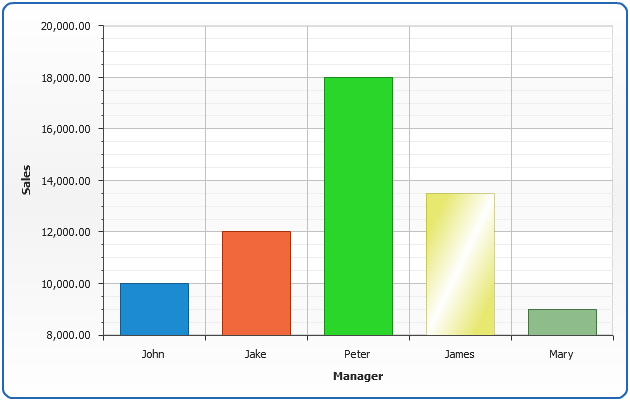
Sample Column Chart Style Using Color Functions
In this sample we will use Color transformations to create a style for Column chart. The idea is that we will use a palette, that contains basic colors, and all states (hover, pushed, selected, etc.) - will use color transformations.
Note: %Color keyword is used in styles to get the Color of the element, this color may be set using palette or directly to point or series. In the sample you can see that in style we do modify only an "abstract" color - having no knowledge what color will be set to a column. This allows us to create some kind of "universal" style: however some would not look nice when using this style, for example: "White" - cause there is no color lighter than "White", so it is not possible to highlight it. So you should keep this in mind when creating your own palettes.
Sample Style definition: Style "ColorFunctions":
We will define style for Column charts named "ColorFunctions" in which colors of a fill and
background will be defined for all states: normal, hovered, pushed, selected, selected hovered and how
points with a missing value, that was interpolated by AnyChart should be displayed:
01 |
<bar_style name="ColorFunctions"> |
02 |
<border type="Solid" color="DarkColor(%Color)" thickness="1" /> |
03 |
<effects enabled="false" /> |
06 |
<fill type="Solid" color="%Color" opacity="1" /> |
07 |
<effects enabled="false" /> |
10 |
<fill type="Solid" color="LightColor(%Color)" opacity="1" /> |
11 |
<effects enabled="false" /> |
14 |
<fill type="Solid" color="DarkColor(%Color)" opacity="1" /> |
15 |
<border type="Solid" color="Black" thickness="2" /> |
16 |
<effects enabled="true"> |
17 |
<bevel enabled="true" /> |
21 |
<fill type="Solid" color="LightColor(%Color)" opacity="1" /> |
22 |
<hatch_fill enabled="True" color="DarkColor(%Color)" /> |
25 |
<fill type="Solid" color="LightColor(%Color)" opacity="1" /> |
26 |
<hatch_fill enabled="True" color="%Color" /> |
29 |
<fill type="Gradient" opacity="1"> |
31 |
<key position="0" color="LightColor(%Color)" /> |
32 |
<key position="0.5" color="White" /> |
33 |
<key position="1" color="LightColor(%Color)" /> |
36 |
<hatch_fill enabled="false" /> |
Live Sample: Sample Single-Series Column Chart with Color Management Functions