Legend: Title and Date-Time Labels
Overview
Legend has two text elements that allow to show date ane time of the hovered point or the range of data displayed, they are Title and Date-Time Label. Also, these elements can show simple static text.
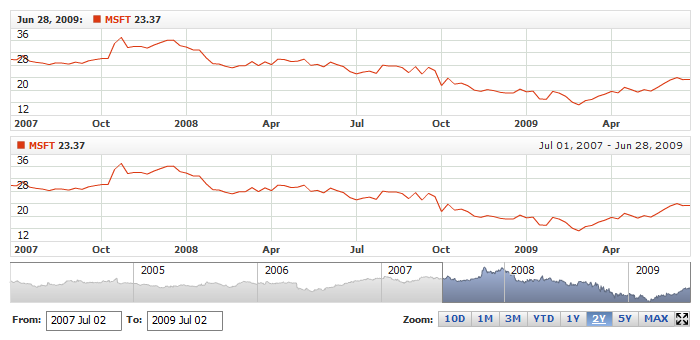
Illustration below highlights them on a sample chart:
Title is the label on the left, by default it shows the date if the hovered point, if the mouse doesn't hover any point the title shows the end of the displayed range.
Date-Time Label is the label on the right, by default it displays the selected range.
Title and Date-Time lable are similar - the only difference is their place inside the legend. They are configured in <title> and <date_time_label> subnodes of <legend> node for each chart.
Sample XML:
01 |
<?xml version="1.0" encoding="UTF-8"?> |
02 |
<stock xmlns="http://anychart.com/products/stock/schemas/1.9.0/schema.xsd"> |

Turning On / Off
By default both elements are enabled, to disable them set enabled attribute to false.
Sample XML to turn both elements off:
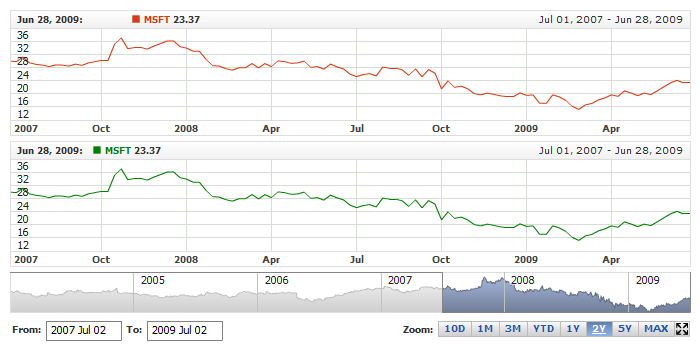
Live sample below shows two charts - with Date-Time Label disabled for the first one and with Title disabled for the second:
Live Sample: Legend - Enable and Disable Title
States
Both labels can show different text in two states:
Mouse Over - when user hovers some data point.
Mouse Out - when no point is hovered.
For each state the following options can be configured:
- Formatting string - sets the text to be displayed, which can include tokens and/or statiс text.
- Font Settings - sets the font.
XML below shows these settings:
Font settings
To configure the font for the labels typical <font> node is used, which is described in details in Font Configuration article.
Sample XML for setting font for both elements in different states:
Live sample below shows settings given above:
Live Sample: Legend - Title Font Settings
Text Formatting
To define text to be displayed in Title and Date-Time Label you need to set formatting string for both states. You can either use static text and/or use {%Date} token.
To define formatting string <format> subnode of <mouse_over> and <mouse_out> nodes is used. Sample XML for setting Title formatting follows:
Static Text
To show static text in Title or Date-Time Label just type it into <format> node, for example: <format>MSFT Corp. 2005-2008: </format>. To use special symbols please use CDATA block
XML below shows how to set static text for both elemenet. Note that you should set format for both states if you want this text to be the same no matter what happens:
Live sample below shows these elements with static text in them:
Live Sample: Legend - Formatting with Static Text
Date Time Tokens
Instead or in addition to static text you can use {%Date} token, which provides you an ability to show some dynamic chart information, which reflects current chart state.
To show the date you just need to put {%Date} into the formatting, where needed. For example: <format>Date: {%Date.*}</format>, with one of the token properties listed below specified instead of "*".
Table below list all token properties:
| Property |
Description |
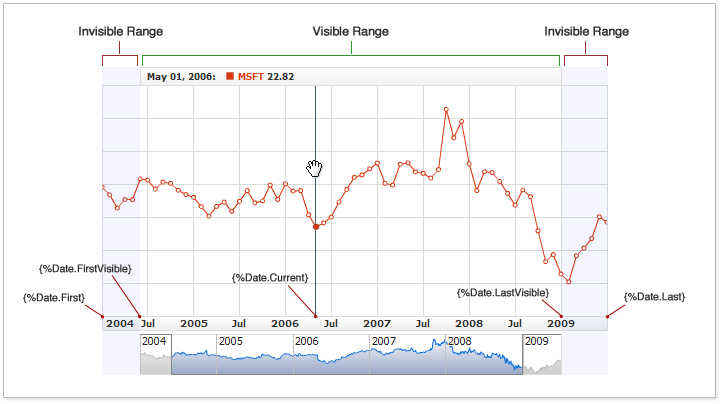
| {%Date.Current} |
Date time of the hovered point. |
| {%Date.First} |
Date time of the first point in the dataset. |
| {%Date.Last} |
Date time of the last point in the dataset. |
| {%Date.FirstVisible} |
Date time of the first point in the range shown. |
| {%Date.LastVisible} |
Date time of the last point in the range shown. |
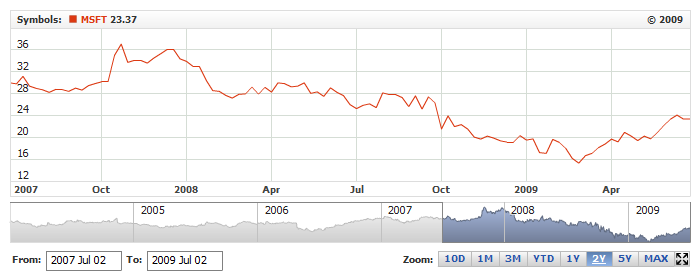
Illustration below gives visible explanation for each property of the token:
You can use {%Date} several times in one formatting string - with different properties. Sample XML below shows how to use token in formatting string of Title and Date-Time Label:
05 |
<format><![CDATA[Mouse Over - {%Date.Current}{"%MMMM %dd, %yyyy"}: ]]></format> |
08 |
<format><![CDATA[Mouse Out - {%Date.LastVisible}{"%yyyy-%mm-%dd"}: ]]></format> |
15 |
<format><![CDATA[Current Date: {%Date.Current}{"%yyyy-%mm-%dd; %hh:%mm %tt"}]]></format> |
18 |
<format><![CDATA[Visible Range: {%Date.FirstVisible}{"%yyyy-%mm-%dd"} - {%Date.LastVisible}{"%yyyy-%mm-%dd"}]]></format> |
05 | format: "Mouse Over - {%Date.Current}{\"%MMMM %dd, %yyyy\"}: " |
08 | format: "Mouse Out - {%Date.LastVisible}{\"%yyyy-%mm-%dd\"}: " |
15 | format: "Current Date: {%Date.Current}{\"%yyyy-%mm-%dd; %hh:%mm %tt\"}" |
18 | format: "Visible Range: {%Date.FirstVisible}{\"%yyyy-%mm-%dd\"} - {%Date.LastVisible}{\"%yyyy-%mm-%dd\"}" |
You can see that you can define date time format when you use the {%Date} token, for example: {%Date.Current}{"%MMMM %dd, %yyyy"}, "%MMMM %dd, %yyyy" stiring in braces that follows the token defines format for timestamp.
You can define any format for the value using these patterns. Date Time formatting is described in details in Date-Time Formatting article .
Live sample below shows how different properties of {%Date} token can be used:
Live Sample: Legend - Formatting Using Tokens
Title Width
When you use {%Date} token in Title - the width of the label varies depending on the current value of the date, this may lead to "jumping" series labels to the right of the title. TO avoid this you can set the fixed width for the title.
Sample XML to define Title width:
Sample below shows a chart with a Title showing current hovered date while the mouse is over the chart. That makes labels "jump" on the chart where Title width isn't set (the second chart), and makes labels stay on their places where Title width is set (the first chart):
Live Sample: Legend - Title with Fixed Width