01 | { |
02 | id: "Label_1", |
03 | type: "Label", |
04 | chart: "idMainChart", |
05 | labelAnnotation: { |
06 | timeAnchor: "2009-01-17", |
07 | valueAnchor: 20 |
08 | } |
09 | } |
Label annotations are created to add text annotations to the chart. You can add any text of your choice and even have some nice features that can make adding annotations easier.
![]()
To add a Label annotation to a chart you need to, as with any other annotation, add an annotation node, assign the id, set "Label" type and specify the chart id using chart attribute.
In label_annotation node you need specify value and time anchors, which define two points needed to draw this type of annotation.
All this you can see in the basic XML/JSON snippet below:

01 |
<annotation id="Label_1" type="Label" chart="idMainChart"> |
02 |
<label_annotation time_anchor="2009-01-17" value_anchor="20" /> |
03 |
</annotation> |
01 | { |
02 | id: "Label_1", |
03 | type: "Label", |
04 | chart: "idMainChart", |
05 | labelAnnotation: { |
06 | timeAnchor: "2009-01-17", |
07 | valueAnchor: 20 |
08 | } |
09 | } |
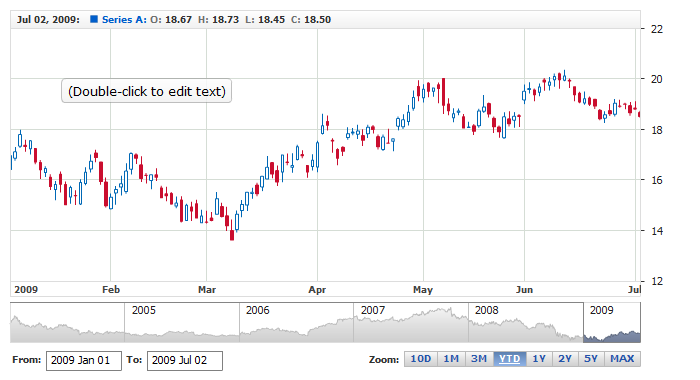
Live sample below shows a chart with this sample Label annotation:
![]()
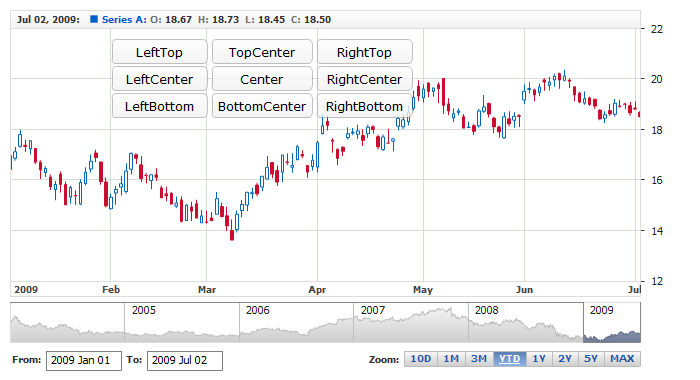
Label is placed to the plot using two anchors: time_anchor and value_anchor, besides that you have an ability to align and position the label relative to this point. Four attributes do that:
| Attribute | Possible Values | Description |
|---|---|---|
| halign | Left Center Right |
Sets horizontal alignment. |
| valign | Top Center Bottom |
Sets vertical alignment. |
| x_padding | Number in pixels | Sets horizontal padding. |
| y_padding | Number in pixels | Sets vertical padding. |
Take a look at the live sample below: all ten labels have the same time_anchor and value_anchor, but the alignments and x and y paddings put them in different places.
![]()
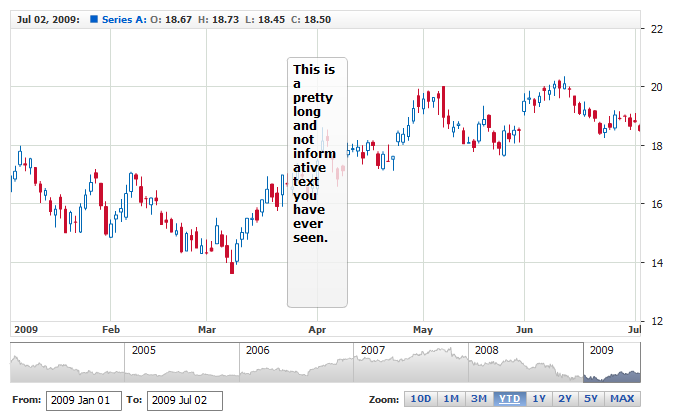
You can set label width and height in pixels. If you set fixed width and text is longer - automatic line breaks will be added.
To control width and height you should use width and height attributes of <settings> node. Sample XML/JSON snippet shows this:
01 |
<annotation id="Label_3" type="Label" chart="idMainChart"> |
02 |
<label_annotation time_anchor="2009-01-17" value_anchor="14"> |
05 |
</settings> |
06 |
</label_annotation> |
07 |
</annotation> |
01 | { |
02 | id: "Label_3", |
03 | type: "Label", |
04 | chart: "idMainChart", |
05 | labelAnnotation: { |
06 | timeAnchor: "2009-01-17", |
07 | valueAnchor: 14, |
08 | settings: { |
09 | width: 50, |
10 | height: 100, |
11 | format: "This is a pretty long and not informative text you have ever seen." |
12 | } |
13 | } |
14 | } |
Live sample with these attributes:
![]()
Labels are made to put text on the chart, so there are several important things you need to know about working with text in them.
Text into labels can be either built-in and appear in them when annotation is added or entered by a user. To add annotation with text built-in you should use format node, like that:
01 |
<annotation id="Label_3" type="Label" chart="idMainChart"> |
02 |
<label_annotation time_anchor="2009-01-17" value_anchor="14"> |
03 |
<settings> |
05 |
</settings> |
06 |
</label_annotation> |
07 |
</annotation> |
01 | { |
02 | id: "Label_3", |
03 | type: "Label", |
04 | chart: "idMainChart", |
05 | labelAnnotation: { |
06 | timeAnchor: "2009-01-17", |
07 | valueAnchor: 14, |
08 | settings: { |
09 | format: "Sample text" |
10 | } |
11 | } |
12 | } |
Note, that there is a format node in each state, so you may change the text depending on actions performed.
By default text in labels can be edited, but you can forbid this using allow_text_edit attribute, like that:
01 |
<annotation id="Label_3" type="Label" chart="idMainChart"> |
02 |
<label_annotation allow_text_edit="false" time_anchor="2009-01-17" value_anchor="14"> |
03 |
<settings> |
05 |
</settings> |
06 |
</label_annotation> |
07 |
</annotation> |
01 | { |
02 | id: "Label_3", |
03 | type: "Label", |
04 | chart: "idMainChart", |
05 | labelAnnotation: { |
06 | allowTextEdit: false, |
07 | timeAnchor: "2009-01-17", |
08 | valueAnchor: 14, |
09 | settings: { |
10 | format: "Sample text" |
11 | } |
12 | } |
13 | } |
Also note, that allow_text_edit forbids only text editing, but label still can be moved - to forbid this as well you need to set to false allow_edit attribute of annotation node.
Note: There is a special attribute, that controls whether labels enters editing state after it is added by startDrawingAnnotation() method, it is called edit_text_after_create.
You can format text in Labels and for this formatting you have two important tools: first of all you can add and format {%Value} and {%Date} tokens which return value_anchor and time_anchor values. These tokens can be formatted as any other token in AnyStock, you can learn about that at:
Also, you can use html formatting in text, to do so you need to set render_as_html attribute of font node to true and use CDATA within format node.
Sample XML snippet below shows a label with HTML formatted text and tokens:
01 |
<annotation id="Label_3" type="Label" chart="idMainChart"> |
02 |
<label_annotation allow_text_edit="false" time_anchor="2009-01-17" value_anchor="14"> |
03 |
<settings> |
04 |
<font render_as_html="true" /> |
06 |
</settings> |
07 |
</label_annotation> |
08 |
</annotation> |
01 | { |
02 | id: "Label_3", |
03 | type: "Label", |
04 | chart: "idMainChart", |
05 | labelAnnotation: { |
06 | allowTextEdit: false, |
07 | timeAnchor: "2009-01-17", |
08 | valueAnchor: 14, |
09 | settings: { |
10 | font: { |
11 | renderAsHtml: true |
12 | }, |
13 | format: "<b>Date</b>: {%Date}{\"%M/%d/%yyyy}" |
14 | } |
15 | } |
16 | } |
![]()
If you have multi line text you can use align attribute of <font> node, possible values are: Left, Center or Right. XML/JSON snippet below shows how to set center text alignment:
01 |
<annotation id="Label_3" type="Label" chart="idMainChart"> |
02 |
<label_annotation time_anchor="2009-01-17" value_anchor="14"> |
03 |
<settings> |
05 |
</settings> |
06 |
</label_annotation> |
07 |
</annotation> |
01 | { |
02 | id: "Label_3", |
03 | type: "Label", |
04 | chart: "idMainChart", |
05 | labelAnnotation: { |
06 | timeAnchor: "2009-01-17", |
07 | valueAnchor: 14, |
08 | settings: { |
09 | font: { |
10 | align: "Center" |
11 | } |
12 | } |
13 | } |
14 | } |
Live sample with all possible align values:

![]()
You have a total control over the look of Labels, to define visual settings you need to add settings node and then use font and background nodes to set how it should look like. Sample XML/JSON snippet below shows this:
01 |
<annotation id="Label_3" type="Label" chart="idMainChart"> |
02 |
<label_annotation color="White" time_anchor="2009-01-17" value_anchor="14"> |
03 |
<settings> |
05 |
<background enabled="true"> |
08 |
</background> |
09 |
</settings> |
10 |
</label_annotation> |
11 |
</annotation> |
01 | { |
02 | id: "Label_3", |
03 | type: "Label", |
04 | chart: "idMainChart", |
05 | labelAnnotation: { |
06 | color: "White", |
07 | timeAnchor: "2009-01-17", |
08 | valueAnchor: 14, |
09 | settings: { |
10 | font: { |
11 | bold: true |
12 | }, |
13 | background: { |
14 | enabled: true, |
15 | fill: { |
16 | type: "Solid", |
17 | color: "Black", |
18 | opacity: 1 |
19 | }, |
20 | border: { |
21 | color: "Gray" |
22 | } |
23 | } |
24 | } |
25 | } |
26 | } |
If you click on font or border node in the snippet, XML or JSON reference will be opened and you will be able to browse all possible settings, including the look of the label in different states.
Also, you can edit the look of the label on hover, on edit and so on. There is a special state for changing the look of the label in edit state: text_edit, you can even alter text of the label in this state. For example, you can put there localized hint about editing. Sample snippet below makes label show editing hint in Russian:
01 |
<annotation id="Label_3" type="Label" chart="idMainChart"> |
02 |
<label_annotation color="Green" time_anchor="2009-01-17" value_anchor="14"> |
03 |
<settings> |
04 |
<states> |
05 |
<text_edit> |
07 |
</text_edit> |
08 |
</states> |
09 |
</settings> |
10 |
</label_annotation> |
11 |
</annotation> |
01 | { |
02 | id: "Label_3", |
03 | type: "Label", |
04 | chart: "idMainChart", |
05 | labelAnnotation: { |
06 | color: "Green", |
07 | timeAnchor: "2009-01-17", |
08 | valueAnchor: 14, |
09 | settings: { |
10 | states: { |
11 | textEdit: { |
12 | format: "Введите текст и нажмите Ctrl+Enter" |
13 | } |
14 | } |
15 | } |
16 | } |
17 | } |
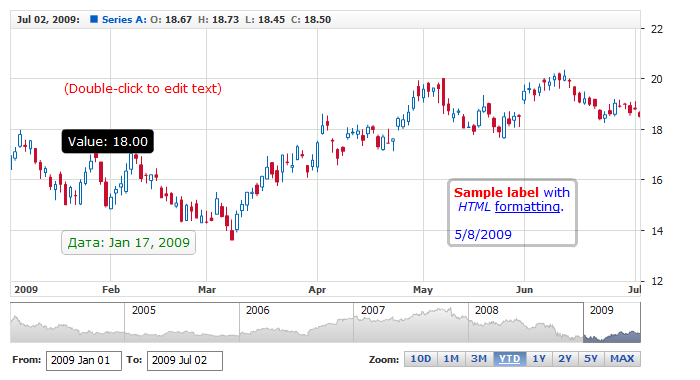
Live sample below contains several labels formatted in different way:
![]()