Andrew's Pitchfork Annotation
Overview
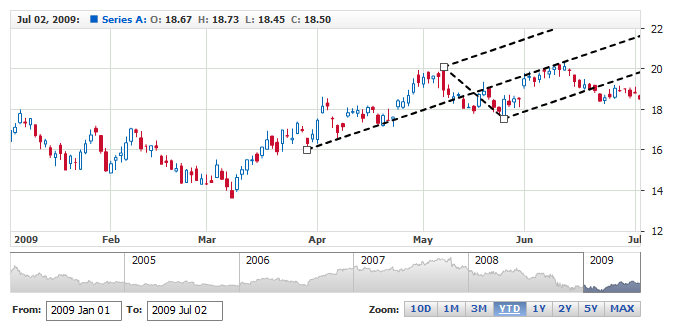
Andrew's Pitchfork, also known as "median line studies", is a technical indicator that uses three parallel trendlines to identify
possible levels of support and resistance. The trendlines are created by placing three points at the end of identified trends. This is usually
achieved by placing the points in three consecutive peaks or troughs. Once the points have been placed, a straight line is drawn from the first
point that intersects the midpoint of the other two.
Because of its shape this indicator is called a pitchfork. The first point drawn on the chart forms the handle, while the lines
extending from the other two points will make up the prongs.
Andrew's Pitchfork annotation allows to add this type of drawing to the chart, as any other annotation it can
be drawn by user or added to the chart via XML or JSON settings. In this article you can learn how
to add it via XML or JSON settings and what visual settings can be done.
To learn about basic settings, that can be done with an annotation please refer to: Drawing Tools and Annotations: General Settings.

Adding annotation via settings
To add an Andrew's Pitchfork annotation to a chart you need to, as with any other annotation, add an annotation node, assign
the id, set "AndrewsPitchfork" type and specify the chart id using chart attribute.
In andrews_pitchfork_annotation node you need specify value and time anchors, which define three points needed
to draw this type of annotation.
All this you can see in the basic XML/JSON snippet below:
01 |
<?xml version="1.0" encoding="UTF-8"?> |
02 |
<stock xmlns="http://anychart.com/products/stock/schemas/1.9.0/schema.xsd"> |
05 | id: "Pitchfork_0856719161", |
06 | type: "AndrewsPitchfork", |
Live sample below shows a chart with this sample basic Andrew's Pitchfork annotation:
Live Sample: Adding Andrew`s Pitchfork Annotation
Visual settings
You have a total control over the look of the Andrew's Pitchfork, to define visual settings you
need to add settings node and then use line node to set how it
should look like. Sample XML/JSON snippet below shows this.
If you click on line node in the snippet, XML or JSON reference
will be opened and you will be able to browse all possible settings, including the look of the line in
different states.
01 |
<?xml version="1.0" encoding="UTF-8"?> |
02 |
<stock xmlns="http://anychart.com/products/stock/schemas/1.9.0/schema.xsd"> |
05 | id: "Rectangle_0856719161", |
06 | type: "AndrewsPitchfork", |
Live sample below contains Andrew's Pitchfork Annotation colored, note
that editing markers coloring is also modified here:
Live Sample: Andrew`s Pitchfork Annotation - Visual Settings