Preparing Data for Bar Chart
Data Table
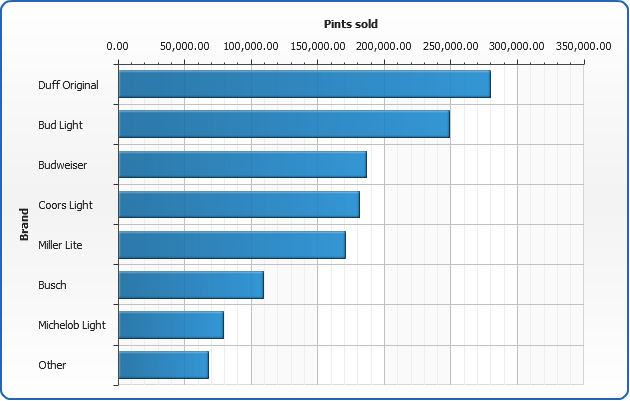
As it was said in Dashboard Creation Tutorial we have the beer brands popularity chart, as follows:
| Brand |
Pints Sold |
| Duff Original |
279 450 |
| Bud Light |
249 028 |
| Budweiser |
186 467 |
| Coors Light |
181 084 |
| Miller Lite |
170 815 |
| Busch |
109 512 |
| Michelob Light |
79 234 |
| Other |
67 913 |

Converting to XML
Now we need to convert this data table into XML, this format will be accepted by AnyChart. In terms of AnyChart data model we have one series of data with categories that hold beer brands names. Each point in series represents one brand and its sales amount in pints. Converted XML Data looks like:
01 |
<?xml version="1.0" encoding="UTF-8"?> |
04 |
<chart plot_type="CategorizedHorizontal"> |
07 |
<point name="Duff Original" y="279450" /> |
08 |
<point name="Bud Light" y="249028" /> |
09 |
<point name="Budweiser" y="186467" /> |
10 |
<point name="Coors Light" y="181084" /> |
11 |
<point name="Miller Lite" y="170815" /> |
12 |
<point name="Busch" y="109512" /> |
13 |
<point name="Michelob Light" y="79234" /> |
14 |
<point name="Other" y="67913" /> |
18 |
<title enabled="false" /> |
22 |
<text><![CDATA[Pints sold]]></text> |
26 |
<labels align="Outside" /> |
28 |
<text><![CDATA[Brand]]></text> |
As you can see, we've created one <series> node, specified its type="Bar", added several <point> nodes and set name attribute that defines bar category and y attribute that defines bar value.
Additional Chart Settings
All we need to do to finalize bar chart XML creation is to define plot_type="CategorizedHorizontal" in <chart> node and add axes titles. Here it is - AnyChart can now visualize data.
Look at the chart sample below and click on on it to see Live Flash Chart preview and full configured XML.
Live Sample: Sample Single-Series Bar Chart Additional Chart Settings
Get Back to Dashboard Creation Tutorial.