Palettes
Overview
AnyChart uses palettes for auto coloring. There are three types of palettes:
Color palettes, Hatch palettes and Marker palettes,
each palette is a named list of predefined items: colors, hatch fills and markers, respectively.
Palettes can be applied to whole chart or given data series, as described in Palette Application
Section.
You can create any number of your own palettes, give them the unique names and apply to whole chart or given data series. Also, you can use predefined AnyChart palettes.
Now, lets look at the sample XML and see how palettes are organized:
Color palettes
There are two types of color palettes:
Distinct Colors
Distinct Colors palette is a set of colors, defined by color attribute in <item> node.
Color can be set using any of the color setting methods described in Color management tutorial. If there are more points in data set than defined in distinct color palette - points will start coloring from the beginning of the palette.
01 |
<palette name="SampleColorPalette" type="DistinctColors"> |
02 |
<item color="AliceBlue" /> |
03 |
<item color="RGB(250,235,215)" /> |
04 |
<item color="HSB(160,100,75)" /> |
05 |
<item color="#DEB887" /> |
Color Range
When using Color Range you don't have to set all colors for your data sets (as in DistinctColors mode). In this mode you have to specify a number of elements you want to have in a palette and a sequence of colors. For example you have series with 20 point in it and you want to color them evenly from Red to Yellow. In <palette> node you have to specify type="ColorRange" and color_count="20", and describe gradient with two colors within a <palette> node. As a result you'll get a palette with 20 colors that will smoothly change from Red to Yellow. XML Settings for such palette are given below:
01 |
<palette name="SampleColorRangePalette" type="ColorRange" color_count="20"> |
04 |
<key color="Yellow" /> |
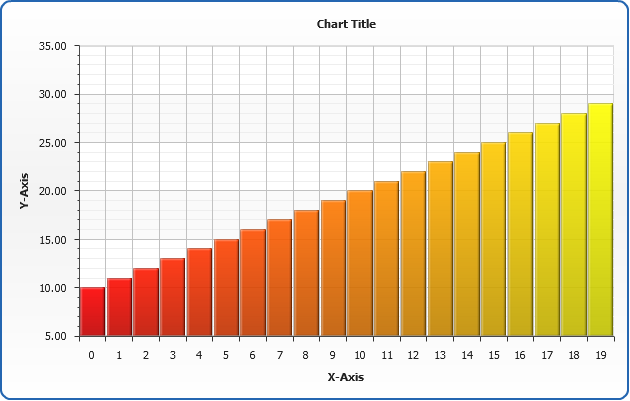
And here is a live sample of Color Range Palette usage. There are 20 points in one series in this column chart, and they are colored using Red-to-Yellow color range palette:
Live Sample: Palettes - Color Range Simple Sequence

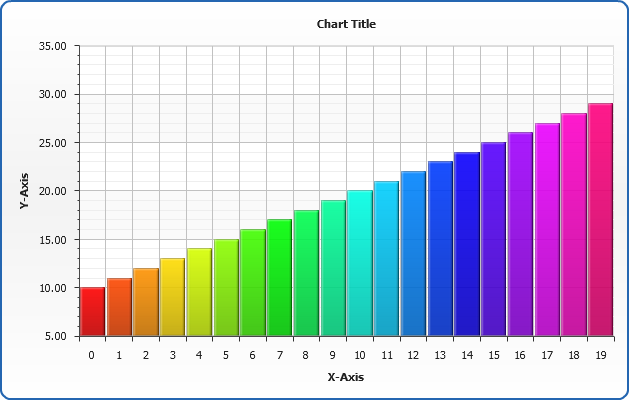
The number of the keys in gradient is unlimited and you can set any color sequence for interpolation. Moreover you can adjust color key position using position attribute of <key> node (position varies from 0 to 1). To show this option we will make another sample. Using Hsb(h,s,b) function (see Coloring Methods to learn what it is) we will add 12 keys into gradient changing only color hue (+30 degrees for each new key). As a result we will get gradient shown on the picture below, where each tickmark corresponds to a key into gradient settings:
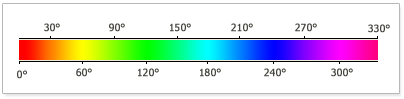
Here is an XML for such palette:
01 |
<palette name="SampleColorRangePalette" type="ColorRange" color_count="auto"> |
03 |
<key color="Hsb(0,100,100)" /> |
04 |
<key color="Hsb(30,100,100)" /> |
05 |
<key color="Hsb(60,100,100)" /> |
06 |
<key color="Hsb(90,100,100)" /> |
07 |
<key color="Hsb(120,100,100)" /> |
08 |
<key color="Hsb(150,100,100)" /> |
09 |
<key color="Hsb(180,100,100)" /> |
10 |
<key color="Hsb(210,100,100)" /> |
11 |
<key color="Hsb(240,100,100)" /> |
12 |
<key color="Hsb(270,100,100)" /> |
13 |
<key color="Hsb(300,100,100)" /> |
14 |
<key color="Hsb(330,100,100)" /> |
Sample chart using this palette:
Live Sample: Palettes - Color Range Sequence with Keys Positions
Auto Color Count
Note that in the last sample we've used "auto" value for color_count attribute. Auto value (default for this attribute - color_count will be auto if you wouldn't specify it at all) gets a number of series or points on a given chart and smoothes color range palette keys from first to last.
So, when color_count is auto - the colors in a color range palette depend on a quantity of points (or series) in a certain chart, use auto mode when you don't know how many points (or series) will contain your chart and you want to see them colored with a different colors in any case.
Hatch palette
Hatch palette is a set of hatch fill items, the only required attribute
is type, pattern_size, color and opacity are optional.
01 |
<hatch_palette name="SampleHatchPalette"> |
02 |
<item type="ZigZag" size="15" thickness="1" color="White" opacity="1" /> |
03 |
<item type="HorizontalBrick" size="10" thickness="2" color="Black" opacity="1" /> |
Marker palette
Marker palette is a set of marker shapes (type attribute) items.
01 |
<marker_palette name="SampleMarkerPalette"> |
03 |
<item type="XCross" /> |
04 |
<item type="Circle" /> |
05 |
<item type="Square" /> |
Palettes application
AnyChart allows to apply color palettes to all series or to the exact series.
In the first case each next series will take each next color from palette. If the number of
the colors in palette is less than the number of series - palette will be looped. If you have
only one series it will be colored by the first color in the palette.
Apply to all series
To apply palette to all
series we have to set palette, hatch_palette or marker_palette attributes in <data> node:
01 |
<data palette="SampleColorPalette" hatch_palette="SampleHatchPalette" marker_palette="SampleMarkerPalette" /> |
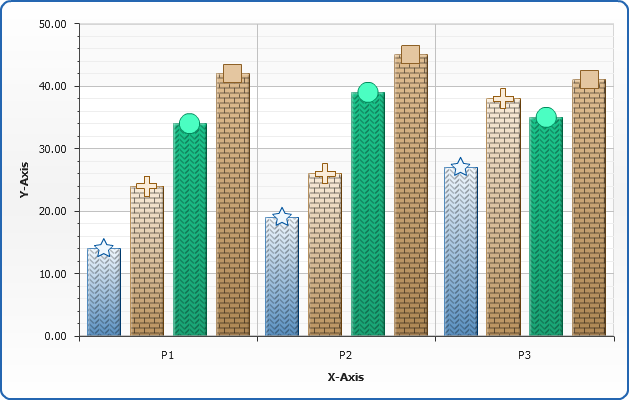
Here is a sample of application sample palettes described above to the
sample data with four series, as you can see Hatch Palette has only two items, and it is looped:
Live Sample: Palettes - Application to all series Sample
Apply to the given series
To apply palette to the given
series we have to set palette, hatch_palette or marker_palette attributes
in <series> node:
01 |
<series name="Series 1" palette="SampleColorPalette" hatch_palette="SampleHatchPalette" marker_palette="SampleMarkerPalette"> |
02 |
<point name="P1" y="14" /> |
03 |
<point name="P2" y="19" /> |
04 |
<point name="P3" y="27" /> |
05 |
<point name="P4" y="11" /> |
06 |
<point name="P5" y="29" /> |
07 |
<point name="P6" y="36" /> |
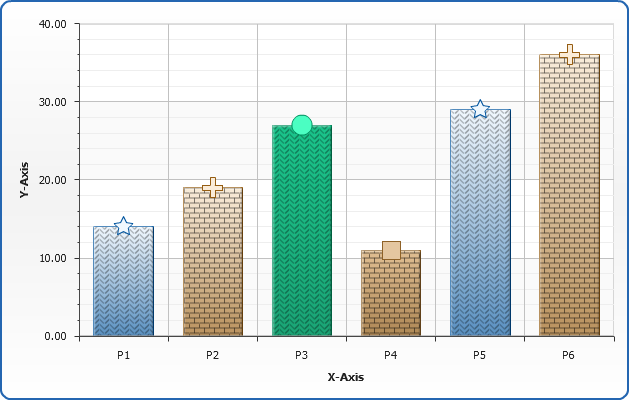
Here is a sample of application sample palettes described above to the
sample given series, as you can see all palettes are looped:
Live Sample: Palettes - Application to the given series Sample
Setting application for certain chart type
You can set whether palettes set in <data> node is applied to Series or Points for each chart type, just use apply_palettes_to attribute in series settings, for example:
02 |
<pie_series apply_palettes_to="Points" /> |
03 |
<bar_series apply_palettes_to="Series" /> |
Setting application for all chart types
You can set whether palettes set in <data> node is applied to Series or Points for all chart types, just use apply_palettes_to attribute in <data_plot_settings> settings, for example:
01 |
<data_plot_settings apply_palettes_to="Points" /> |
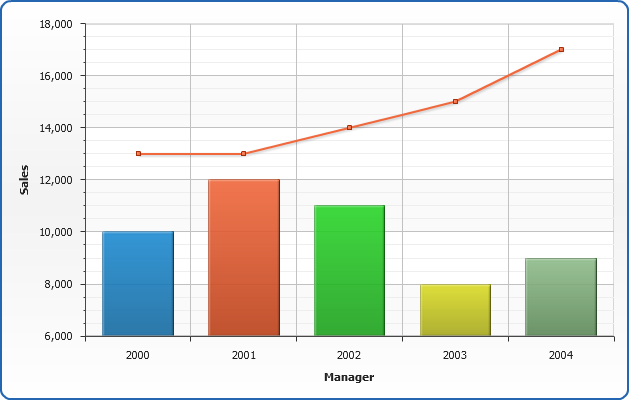
In the sample below line chart is colored by series and column chart - by points:
Live Sample: Sample Palette Application Different series types
Predefined palettes
There are one predefined color palette, one hatch and one marker palette. You
can use them just like custom palettes, specifying name in appropriate attributes. Note, that the "Default"
color, hatch and marker palettes are applied to all series by default.
To all series:
01 |
<data palette="Default" hatch_palette="Default" marker_palette="Default" /> |
To the given series:
01 |
<series name="Series 1" palette="Default" hatch_palette="Default" marker_palette="Default"> |
02 |
<point name="P1" y="14" /> |
03 |
<point name="P2" y="19" /> |
04 |
<point name="P3" y="27" /> |
05 |
<point name="P4" y="11" /> |
06 |
<point name="P5" y="29" /> |
07 |
<point name="P6" y="36" /> |
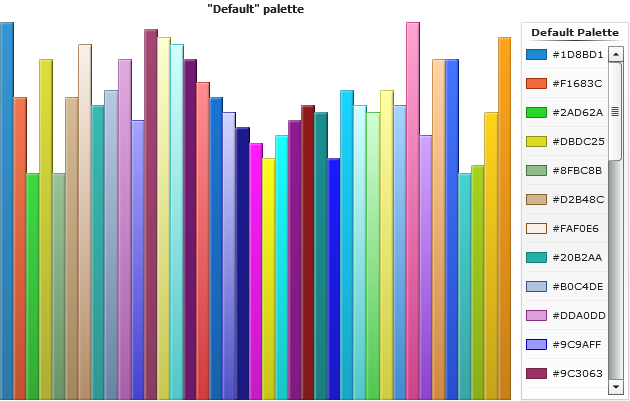
Predefined Color Palettes
"Default" color palette includes 40 specially selected colors, below you can see a table of all colors from the default palette:
| Color | HEX | RGB | HSB |
|---|
| #1D8BD1 | rgb(29,139,209) | hsb(203,76,47) |
| #F1683C | rgb(241,104,60) | hsb(15,87,59) |
| #2AD62A | rgb(42,214,42) | hsb(120,68,50) |
| #DBDC25 | rgb(219,220,37) | hsb(60,72,50) |
| #8FBC8B | rgb(143,188,139) | hsb(115,27,64) |
| #D2B48C | rgb(210,180,140) | hsb(34,44,69) |
| #FAF0E6 | rgb(250,240,230) | hsb(30,67,94) |
| #20B2AA | rgb(32,178,170) | hsb(177,70,41) |
| #B0C4DE | rgb(176,196,222) | hsb(214,41,78) |
| #DDA0DD | rgb(221,160,221) | hsb(300,47,75) |
| #9C9AFF | rgb(156,154,255) | hsb(241,100,80) |
| #9C3063 | rgb(156,48,99) | hsb(332,53,40) |
| #FFFFCE | rgb(255,255,206) | hsb(60,100,90) |
| #CEFFFF | rgb(206,255,255) | hsb(180,100,90) |
| #630063 | rgb(99,0,99) | hsb(300,100,19) |
| #FF8284 | rgb(255,130,132) | hsb(359,100,75) |
| #0065CE | rgb(0,101,206) | hsb(211,100,40) |
| #CECFFF | rgb(206,207,255) | hsb(239,100,90) |
| #000084 | rgb(0,0,132) | hsb(240,100,26) |
| #FF00FF | rgb(255,0,255) | hsb(300,100,50) |
| #FFFF00 | rgb(255,255,0) | hsb(60,100,50) |
| #00FFFF | rgb(0,255,255) | hsb(180,100,50) |
| #840084 | rgb(132,0,132) | hsb(300,100,26) |
| #840000 | rgb(132,0,0) | hsb(0,100,26) |
| #008284 | rgb(0,130,132) | hsb(181,100,26) |
| #0000FF | rgb(0,0,255) | hsb(240,100,50) |
| #00CFFF | rgb(0,207,255) | hsb(191,100,50) |
| #CEFFFF | rgb(206,255,255) | hsb(180,100,90) |
| #CEFFCE | rgb(206,255,206) | hsb(120,100,90) |
| #FFFF9C | rgb(255,255,156) | hsb(60,100,81) |
| #9CCFFF | rgb(156,207,255) | hsb(209,100,81) |
| #FF9ACE | rgb(255,154,206) | hsb(329,100,80) |
| #CE9AFF | rgb(206,154,255) | hsb(271,100,80) |
| #FFCF9C | rgb(255,207,156) | hsb(31,100,81) |
| #3165FF | rgb(49,101,255) | hsb(225,100,60) |
| #31CFCE | rgb(49,207,206) | hsb(180,62,50) |
| #9CCF00 | rgb(156,207,0) | hsb(75,100,41) |
| #FFCF00 | rgb(255,207,0) | hsb(49,100,50) |
| #FF9A00 | rgb(255,154,0) | hsb(36,100,50) |
| #FF6500 | rgb(255,101,0) | hsb(24,100,50) |
And here is a sample of column chart with 40 elements that are colored using default palette:
Live Sample: Palettes - Predefined Default Palette Sample
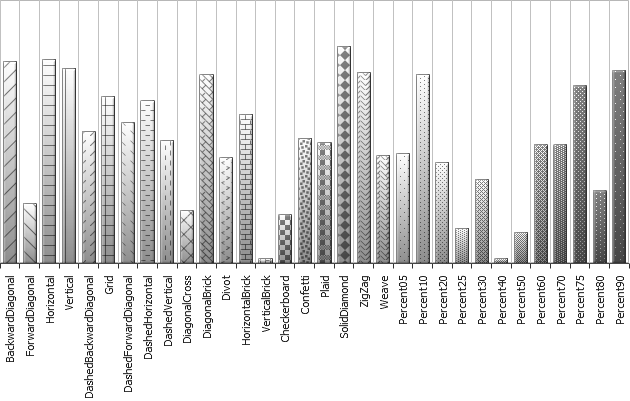
Predefined Hatch Palette
Predefined hatch palette includes all possible hatch fill types and named "Default", on the
sample below you can see the result of its application to the single-series chart:
Live Sample: Palettes - Predefined Hatch Palette Sample
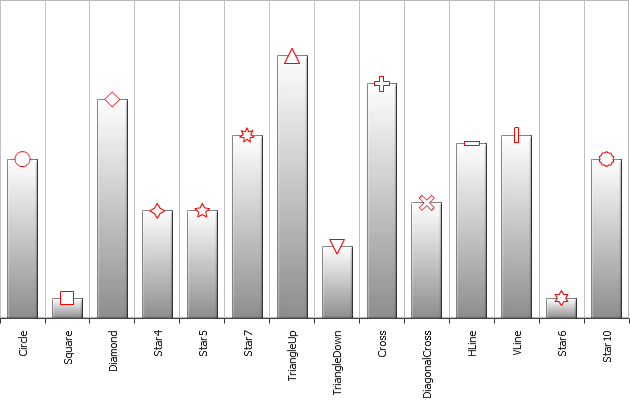
Predefined Marker Palette
Predefined marker palette includes all possible hatch fill types and named "Default", on the
sample below you can see the result of its application to the single-series chart:
Live Sample: Palettes - Predefined Marker Palette Sample