How AnyChart Gets Data
Overview
AnyChart gets data from ANY sources (1), process it on ANY platform (2), creates ANY types of chart (3), and shows it in ANY client’s environment (4).
- You can use any data source, AnyChart doesn't depend on any. Your data can be stored anywhere: relational or object databases (Oracle, MS SQL Server, MySQL, etc.), Excel or CSV files, or anything else you can imagine. There is no need to change them or prepare to use.
- Data can be retrieved and processed by any engine or platform, capable to output XML file. PHP, ASP, ASP.NET, Ruby, PERL, .NET, etc.
- AnyChart configuration XML is easy to create, modify and use. Powerful styles and templates allow you to show what you want. You can configure visualization of any bar, slice, point or bubble. AnyChart allows creating over 60 basic types of charts and great number of combinations.
- AnyChart gets data in XML format and processes it on client side, lowering server load. Flash player ubiquity allows showing your charts almost everywhere.
Data XML Settings differ from chart type to chart type, but, in general, they are all the same, you will find description of data xml section in the beginning of each chart type tutorial.
In this tutorial we will describe the general idea of preparing data for AnyChart Flash Charts and show an example.
Please note that you can pass the data in CSV format - to optimize the size of XML file for large datasets:
To create Data Streaming or fully Client Size interactive applications you can use Java Script data manipulation options:
![]()
General Idea
AnyChart gets only XML data to configure the charts. You can provide physical XML files or dynamically create XML data using server-side or client-side scripts to AnyChart Component.
So, let's see how all thing work on the diagrams below:
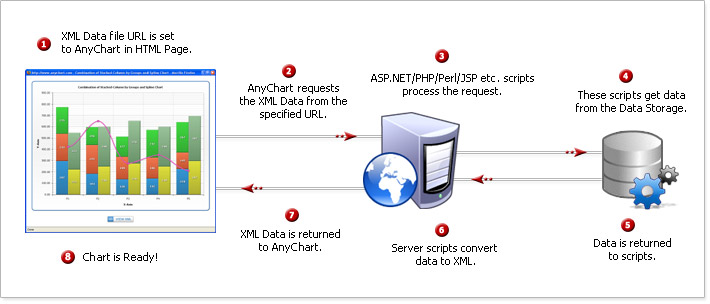
Get XML Data Files from Server
This way of getting data works best when you have some parameters that come to the script page, that define what data should be displayed, this is most common way of using Flash Charts and it can be easily organized using any script language.
This method is shown in Simple Chart and Simple HTML Chart Tutorials.
![]()
Get XML Data Files Content from Server Using Javascript
This AJAX-style method works best when you accept some user actions/values from the page and want to show new chart without reloading page. You should use AnyChart External functions to create such page, the description of this can be found in the samples listed below.
This method is demonstrated in AJAX Sample.
![]()
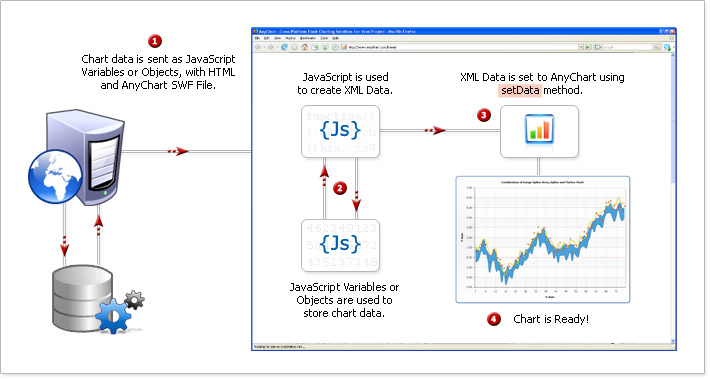
Get XML Data Files URLs from Server Using Javascript
This Javascript method works almost the same way as previous one, but you get set XML Data URL instead of setting all XML as String. You should use AnyChart External functions to create such page, the description of this can be found in the samples listed below.
This method is shown in Set XML As File sample.

![]()
XML Sample Described
In this section we will demonstrate how table data should be converted into AnyChart XML, for more information on data section please see certain chart type tutorial.
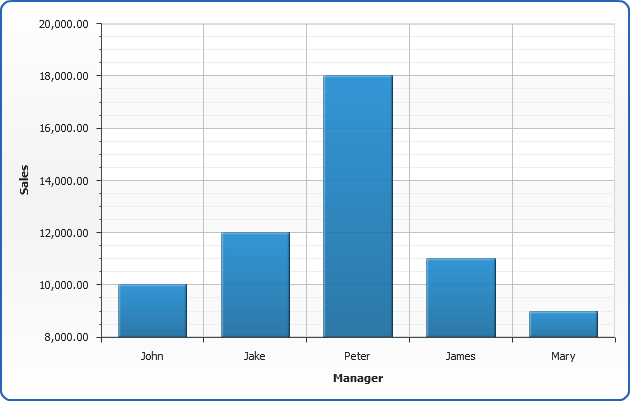
Let's see single-series column chart created using the following data - sales of several managers in one quarter:
| Name | Sales |
|---|---|
| John | $10000 |
| Jake | $12000 |
| Peter | $18000 |
| James | $11000 |
| Mary | $9000 |
This table can be returned from database by some simple query, like:
SELECT sales_name, sum(sales) FROM tbl_orders GROUP BY sales_name
Now we need to convert this data table into XML, this format will be accepted by AnyChart. In terms of AnyChart data model we have one series of data (Sales) with categories that hold managers names. Each point in series represents one manager and his/her sales. Converted XML Data looks like:

01 |
<data> |
02 |
<series name="Sales" type="Bar"> |
03 |
<point name="John" y="10000" /> |
04 |
<point name="Jake" y="12000" /> |
05 |
<point name="Peter" y="18000" /> |
06 |
<point name="James" y="11000" /> |
07 |
<point name="Mary" y="9000" /> |
08 |
</series> |
09 |
</data> |
As you can see, we've created one <series> node, specified its type="Bar", added several <point> nodes and set x attribute that defines column category and y attribute that defines column value.
You can organize such conversion using any script/programming language, iterating through the results of the query and formatting the output string.
All we need to do to finalize column chart XML creation is to define plot_type="CategorizedVertical" in <chart> node and add axes titles. Here it is - AnyChart can now visualize your data. Look at the chart sample below and click on XML button if you want to see full configured XML.
![]()