Embed chart into the page using plain HTML
Overview
We recommend to use AnyChart JavaScript Library to embed chart into the page, you can read
how to do that in Create Simple Chart tutorial, to learn why you should do that you can read in JavaScript Library Description.
But if for some reason you don't want to use JavaScript at all - below you will find a tutorial how to embed AnyChart into the page using plain HTML.
Plain HTML Embedding
First of all we need a plain HTML page that contains a Flash object, and place it to some folder on your web site: Below we've done it, creating AnyChartTest folder in IIS wwwroot folder with the following structure:
- /AnyChartTest
- /swf
- anychart.xml
- anychart.html
Terms
Container page: a page where chart will be displayed; this page can be HTML, ASP, ASP.NET, CF, PHP, CGI, Perl (or any other scripting language capable to produce HTML output).
Data provider: AnyChart accepts all data needed to show the chart in a single XML File. The structure of this file will be explained later.
Chart SWF: Charts displayed by AnyChart is contained in a single swf file - that is why we created an swf subfolder.

Choosing Chart data and its visual style
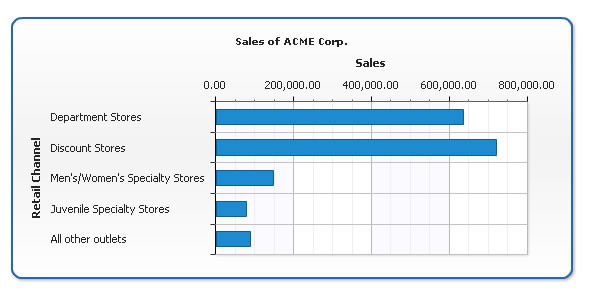
As we are creating a chart we need some data for it. Imagine that we want to compare sales of ACME Corp. retail channels in one year. So, we have the following numbers:
| Retail Channel |
Sales |
| Department Stores |
$637.166 |
| Discount Stores |
$721.630 |
| Men's/Women's Specialty Stores |
$148.662 |
| Juvenile Specialty Stores |
$78.662 |
| All other outlets |
$90.000 |
To transmit this data to AnyChart component we need to convert it to XML, like that:
01 |
<?xml version="1.0" encoding="UTF-8"?> |
04 |
<chart plot_type="CategorizedHorizontal"> |
06 |
<series name="Year 2003" type="Bar"> |
07 |
<point name="Department Stores" y="637166" /> |
08 |
<point name="Discount Stores" y="721630" /> |
09 |
<point name="Men's/Women's Specialty Stores" y="148662" /> |
10 |
<point name="Juvenile Specialty Stores" y="78662" /> |
11 |
<point name="All other outlets" y="90000" /> |
16 |
<text><![CDATA[Sales of ACME Corp.]]></text> |
21 |
<text><![CDATA[Sales]]></text> |
25 |
<labels align="Outside" /> |
27 |
<text><![CDATA[Retail Channel]]></text> |
Now copy the above code, open anychart.xml from AnyChartTest folder in any plain text editor and paste code there.
XML structure may look complex, but most of the tags are self descriptive and we can describe everything done in XML in several words:
In <chart> node we described chart orientation:
we've set a horizontal plot type - <chart plot_type="CategorizedHorizontal">
In <chart_settings> node we described how our chart should look like:
We've set a chart title text:
02 |
<text><![CDATA[Sales of ACME Corp.]]></text> |
We've set an y axis title text:
03 |
<text><![CDATA[Sales]]></text> |
We've set a x axis title text and align of axis labels:
02 |
<labels align="Outside" /> |
04 |
<text><![CDATA[Retail Channel]]></text> |
In <data> node we've created one <series> of data (we will need more series when building a multiseries charts)
In <series> node we've added one <point> node for each retail channel in our table, entered its name and sales value.
e.g. <point name = "Department Stores" y="637166"/> and set series name and type. Series type specifies the way of displaying for this series.
HTML File structure
Only one step remains and we will see our chart on the Web!
Here is the code you should paste in anychart.html (just open it in any text editor and copy-paste the code):
<html>
<head>
<meta http-equiv="Content-Type" content="text/html; charset=UTF-8" />
<title>AnyChart HTML Sample</title>
</head>
<body>
<object classid="clsid:D27CDB6E-AE6D-11cf-96B8-444553540000"
width="600" height="300">
<param name="movie" value="swf/AnyChart.swf" />
<param name="flashvars" value="XMLFile=anychart.xml" />
<embed
type="application/x-shockwave-flash"
src="swf/AnyChart.swf"
flashvars="XMLFile=anychart.xml"
width="600" height="300">
</embed>
</object>
</body>
</html>
Only text in bold is the html code, that you need to embed AnyChart into a HTML page.
Final
Now we should launch our html page in a web browser, in our case we can use both:
http://localhost/AnyChartTest/anychart.html
or
C:\Inetpub\wwwroot\AnyChartTest\anychart.html
If everything was done exactly as described above, you will see the following chart:
You can open this sample from here: Open the Simple Chart Sample
You can open folder with sample files from here: Download the Sample
If you want to try to modify sample in a folder other than live sample folder of AnyChat Documentation you should follow the installation tutorial: Installation of AnyChart to the Web Server of Local Machine
