Working with Fonts in AnyChart
- Overview
- Basic Font Settings
- International Symbols Support
- Using HTML formatting
- Text Rotation
- Text Effects
Overview
You can control font of every text object in AnyChart using <font> subnode of the appropriate node, see full XML Reference to learn which elements have this subnode. Working with fonts is the same for any node and in this tutorial all settings are explained.
The texts have built-in formatting settings (like bold, italic, underline, size, color or font family), that are configured in <font> node - these settings are applied to the given all text within text field, or you can use HTML formatting in text field - in this case all formatting should be done in <text> or <format> nodes (that configure the text of an element).
All text elements, except of legend items and tooltips can be rotated, there are some special things you should know about text rotation - they are covered below in Text Rotation section.
![]()
Basic Fonts Settings
The <font> node has the following attributes that control an appearance of the text: family, size, bold, italic, underline, color and render_as_html. Typical font settings:

01 |
<font family="Verdana" color="Black" size="12" bold="True" italic="False" underline="False" render_as_html="False" /> |
These settings are applied to the given all text within text field, if you want to do more complex formatting (only part of the text is bold, for example) - consider using HTML formatting.
Simple text formatting is shown in International Symbols Support Sample below.
![]()
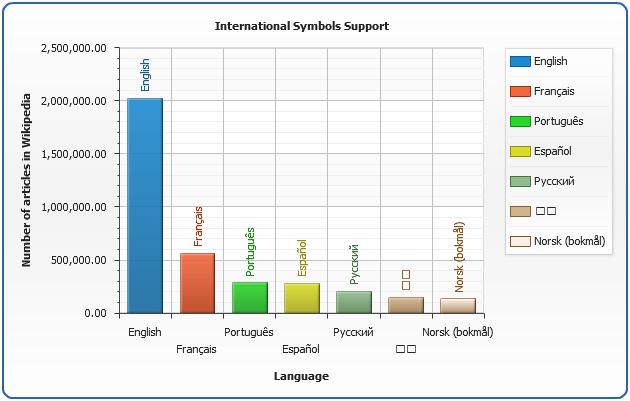
International Symbols Support
Only few words (and a sample) about using International Symbols in AnyChart - AnyChart supports a total Internationalization.
All you need to do to use non-latin symbols in titles, labels, tooltips, legend or else - just use them in <format> or <text> nodes and make sure that you XML files are UTF-8 encoded.
This is sample chart with labels, tooltips and legend in English, French, Portuguese, Spanish, Russian, Chinese and Norwegian.
![]()
Using HTML formatting
If you want to do a complex formatting of the text - consider using HTML formatting. To enable it you have to set render_as_html = "True" in <font> node. Then you need to use CDATA section with HTML tags within <format> or <text> nodes:
01 |
<label_settings> |
02 |
<font render_as_html="True" /> |
03 |
<format><![CDATA[%cbegin <b>Name:</b> {%Name} %cend]]></format> |
04 |
</label_settings> |
![]()
Supported HTML tags
| Tag | Description |
|---|---|
| Bold tag | The <b> tag renders text as bold. A bold typeface must be available for the font used. |
| Break tag | The <br> tag creates a line break in the text field. You must set the text field to be a multi line text field to use this tag. |
| Font tag | The <font> tag specifies a font or list of fonts to display the text.The font tag supports the following attributes:
|
| Italic tag | The <i> tag displays the tagged text in italics. An italic typeface must be available for the font used. |
| Paragraph tag | The <p> tag creates a new paragraph. You must set the text field to be a multi line text field to use this tag. The <p> tag supports the following attributes:
|
| Underline tag | The <u> tag underlines the tagged text. |
![]()
The sample Pie chart below demonstrates all available tags in slice labels formatting:
![]()
Text Rotation
All text elements, except of legend items and tooltips can be rotated, rotation is set using rotation attribute of an appropriate node, for example to rotate X-Axis Labels you have to set:
01 |
<axes> |
02 |
<x_axis> |
03 |
<labels rotation="90" /> |
04 |
</x_axis> |
05 |
</axes> |
Important note: AnyChart recommends you to use rotation angles divisible by 90 - when these angles are used you will always get a required label properly displayed - no matter what font family or character set is used.
![]()
Text Effects
You can apply the effects to Text. Effects are described in Effects tutorial. Typical effects settings are:
01 |
<font> |
02 |
<effects enabled="True"> |
03 |
<drop_shadow enabled="True" /> |
04 |
</effects> |
05 |
</font> |
Here is a sample of Aqua styled pie chat with labels on slices. Labels text drops shadow on the slices:
![]()