<!DOCTYPE HTML PUBLIC "-//W3C//DTD HTML 4.01//EN" "http://www.w3.org/TR/html4/strict.dtd"> <html> <head> <title>Switching Y Axis Scale Mode Dynamically</title> <meta http-equiv="content-type" content="text/html; charset=utf-8"/> <!-- jQuery is used to work with DOM and create calendar control --> <script type="text/javascript" src="js/jquery-1.4.2.min.js"></script> <!-- jquery ui for calendar control --> <link type="text/css" href="css/ui-lightness/jquery-ui-1.8.1.custom.css?v=1.9.0r9317" rel="stylesheet" /> <script type="text/javascript" src="js/jquery-ui-1.8.1.custom.min.js"></script> <script type="text/javascript" language="javascript" src="./../js/AnyChartStock.js?v=1.9.0r9317"></script> <!-- chart size settings --> <style type="text/css"> #chartContainer { width: 650px; height: 550px; float: left; } </style> <script type="text/javascript" language="javascript"> // Creating new chart object. var chart = new AnyChartStock("./../swf/AnyChartStock.swf?v=1.9.0r9317", "./../swf/Preloader.swf?v=1.9.0r9317"); // Setting XML config file. chart.setXMLFile("config.xml"); // needConfig set to true allowas to work with chart objectModel chart.needConfig = true; // Writing the flash object into the page DOM. chart.write("chartContainer"); // document ready $(function(){ // initialize jQuery UI date picker $('#initialDate').datepicker({ inline: true, altFormat: 'yy-mm-dd', dateFormat: 'yy-mm-dd' }); }); //-------------------------------------------------------------------------------- // Scale mode //-------------------------------------------------------------------------------- // function to change y axis scale mode function updateMode() { var mode = $("#mode").val(); // new y axis scale mode // link to main chart settings var mainChart = chart.getChartById("idMainChart"); // legend focus settings var legendFocusSettings = mainChart.legend.labels.focusSettings; // primary value axis settings var axis = mainChart.valueAxes.primary; // datetime highlighter var dateHighlighter = mainChart.xAxis.axisMarkers.lineMarkers[0]; // disable unnecessary fields $("#calculateChangesFrom").attr("disabled", "true"); $("#initialDate").attr("disabled","true"); switch (mode) { // values show scale mode case "Values": axis.scale.mode = "Values"; // update scale mode axis.labels.font.color = "#444444"; // color labels axis.labels.format = "{%Value}{numDecimals:0}"; // set format // update legend settings legendFocusSettings.mouseOver.format = "<textformat tabstops=\"[110]\">{%SeriesIcon} <b><font color=\"%Color\">{%SeriesName}</font> <font color=\"#888888\">Value: </font><font color=\"#333333\">{%Value.Current}</font></b><tab/></textformat>"; legendFocusSettings.mouseOut.format = "<textformat tabstops=\"[110]\">{%SeriesIcon} <b><font color=\"%Color\">{%SeriesName}</font> <font color=\"#888888\">Value: </font><font color=\"#333333\">{%Value.LastVisible}</font></b><tab/></textformat>"; // disable date highlighter dateHighlighter.enabled = false; break; // show changes mode case "Changes": axis.scale.mode = "Changes"; // set scale mode axis.labels.font.color = "%Color"; // labels are colored depending on the value (positive, negative or zero) axis.labels.format = "{%Value}{numDecimals:0,plusSign:true}"; // labels format // update legend to show changes legendFocusSettings.mouseOver.format = "<textformat tabstops=\"[130]\">{%SeriesIcon} <b><font color=\"%Color\">{%SeriesName}</font> <font color=\"#888888\">Change: </font><font color=\"%ChangeColor\">{%ValueChange.Current}{plusSign:true}</font></b><tab/></textformat>"; legendFocusSettings.mouseOut.format = "<textformat tabstops=\"[130]\">{%SeriesIcon} <b><font color=\"%Color\">{%SeriesName}</font> <font color=\"#888888\">Change: </font><font color=\"%ChangeColor\">{%ValueChange.LastVisible}{plusSign:true}</font></b><tab/></textformat>"; // allow changing values changing calculation base $("#calculateChangesFrom").removeAttr("disabled"); // if changes are calculated from the custom date if (axis.scale.calculateChangesFrom == "CustomDate") { $("#initialDate").removeAttr("disabled"); // allow changing base date setBaseDate(); // set base date and highlight it }else { // if there is no base date - hide highlighting dateHighlighter.enabled = false; } break; // show percent changes mode case "PercentChanges": axis.scale.mode = "PercentChanges"; // set scale mode axis.labels.font.color = "%Color"; // labels are colored depending on the value (positive, negative or zero) axis.labels.format = "{%Value}{numDecimals:0,plusSign:true}%"; // change labels format // show percent changes in legend legendFocusSettings.mouseOver.format = "<textformat tabstops=\"[150]\">{%SeriesIcon} <b><font color=\"%Color\">{%SeriesName}</font> <font color=\"#888888\">%Change: </font><font color=\"%ChangeColor\">{%PercentValueChange.Current}{plusSign:true}%</font></b><tab/></textformat>"; legendFocusSettings.mouseOut.format = "<textformat tabstops=\"[150]\">{%SeriesIcon} <b><font color=\"%Color\">{%SeriesName}</font> <font color=\"#888888\">%Change: </font><font color=\"%ChangeColor\">{%PercentValueChange.LastVisible}{plusSign:true}%</font></b><tab/></textformat>"; // allow changing values changing calculation base $("#calculateChangesFrom").removeAttr("disabled"); // if changes are calculated from the custom date if (axis.scale.calculateChangesFrom == "CustomDate") { $("#initialDate").removeAttr("disabled"); // allow changing base date setBaseDate(); // set base date and highlight it }else { // if there is no base date - hide highlighting dateHighlighter.enabled = false; } break; } // apply all changes chart.applySettingsChanges(); } //-------------------------------------------------------------------------------- // Calculate changes from //-------------------------------------------------------------------------------- // function to update calculate changes from - calculation changes base function updateCalculateChangesFrom() { var calculateChangesFrom = $("#calculateChangesFrom").val(); // from where to calculate changes chart.getChartById("idMainChart").valueAxes.primary.scale.calculateChangesFrom = calculateChangesFrom; // set scale settings var dateHighlighter = chart.getChartById("idMainChart").xAxis.axisMarkers.lineMarkers[0]; // link to highlight markers // if changes are calculated from the custom date if (calculateChangesFrom == "CustomDate") { $("#initialDate").removeAttr("disabled"); // allow changing base date setBaseDate(); // set base date and highlight it } else { // if there is no base date $("#initialDate").attr("disabled", true); // disable after changing base date dateHighlighter.enabled = false; // hide highlight } // apply changes chart.applySettingsChanges(); } //-------------------------------------------------------------------------------- // baseDate settings //-------------------------------------------------------------------------------- function setBaseDate() { var date = $("#initialDate").val(); // new base date chart.getChartById("idMainChart").valueAxes.primary.scale.baseDate = date; // set base date to scale var dateHighlighter = chart.getChartById("idMainChart").xAxis.axisMarkers.lineMarkers[0]; // base date highlighter dateHighlighter.enabled = true; // enable dateHighlighter.date = $("#initialDate").val(); // and move to actual date } // updates settigns on base date change function updateInitialDate() { setBaseDate(); // update settings chart.applySettingsChanges(); // apply changes } //--------------------------------------------------------------------------------------------------- // html events binding //--------------------------------------------------------------------------------------------------- $(function() { $("#mode").change(updateMode); $("#calculateChangesFrom").change(updateCalculateChangesFrom); $("#initialDate").change(updateInitialDate); }); //--------------------------------------------------------------------------------------------------- // Enable html controls //--------------------------------------------------------------------------------------------------- chart.onChartDraw = function() { $("#mode").removeAttr("disabled"); chart.onChartDraw = null; } </script> <!-- style settings --> <style type="text/css"> table.settings { border-style: solid; border-width: 1px; border-color: #D0CDC9; width:450px; } table.settings tr th { font:normal 60% Verdana; background-color: #DCD9D5; font-weight:bold; padding-bottom:5px; padding-top:5px; padding-left:10px; padding-right:10px; text-align:left; } table.settings tr td { background-color: #F8F4F0; font:normal 70% Verdana; padding-bottom:2px; padding-top:2px; padding-left:10px; padding-right:10px; text-align:left; } table.settings input, table.settings select { width: 100%; } #initialDate { background-image: url(calendar.png); background-repeat: no-repeat; background-position: center right; } #ui-datepicker-div { font-size: 10pt; } </style> </head> <body> <div id="chartContainer"><!-- Chart Container --></div> <table class="settings"> <tr><th colspan="2">Scale mode settings:</th></tr> <tr> <td>Mode:</td> <td> <select name="mode" id="mode" disabled="disabled" autocomplete="off"> <option value="Values" selected="true">Values</option> <option value="Changes">Changes</option> <option value="PercentChanges">Percent changes</option> </select> </td> </tr> <tr> <td>Calculate changes from:</td> <td> <select name="calculateChangesFrom" id="calculateChangesFrom" disabled="true" autocomplete="off"> <option value="FirstVisible" selected="true">FirstVisible</option> <option value="SeriesStart">SeriesStart</option> <option value="CustomDate">CustomDate</option> </select> </td> </tr> <tr> <td>Base date:</td> <td><input type="text" name="initialDate" id="initialDate" value="2008-03-01" autocomplete="off" disabled="true"/></td> </tr> </table> </body> </html>
Sample Description
How to use this sample?
Use controls to the right of the chart to change scale modes and configure them.
How it works
AnyChart Stock offers you the very flexible Value (Y Axis), you can read about it in Y-Axes Settings article, this sample is totally about Scale Modes and ability change them on the fly using using Object Model modifications.
There are three scale modes available, in this sample you can change them using combo box:
Value | Description |
---|---|
Values | Display values. |
Changes | Display changes in values. |
PercentChanges | Display changes in percents. |
Values mode has no additional settings, but both Changes modes have them, and these settings are available when you choose this modes in combo box. Let's see in detail what exactly is changed when you change scale mode using this combo control: main function source code, that does the changes is updateMode.
Common Things
First of all link to the chart object is obtained using getChartById function, then using object model we create links to axis, legend and axis marker objects (the last one is used only in Changes modes and it is not necessary).
In axis object we have to change the scale mode itself and axis labels format, which should be different for every mode, and in legend object we have to change format too - if we display different things on the chart, legend should reflect this as well. Take a look at the illustration below to notice the changes:
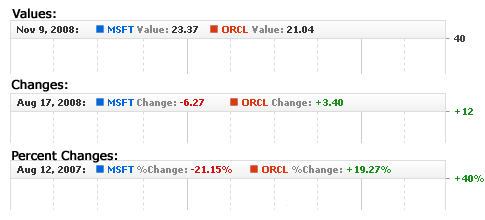
Modifications in Changes Modes
When you choose one of the changes modes you can also choose the date from which the changes are calculated: this date can be either static (Series Start or Custom Date) or dynamic (First Visible). Note, that calendar control is a custom element created with a help of jQuery library and that we add axis marker with the label to the chart to mark the custom base date (if Custom Date is used and configured).
AnyChartStock JavaScript API
This sample uses the following methods, properties and events from AnyChartStock JavaScript API:
Item | Type | Description |
---|---|---|
needConfig | Property (Boolean) | Defines whether the access to full chart configuration object model is required. |
applySettingsChanges | Method | Commits changes made to settings element of the objectModel. |
getChartById | Method | Returns link to a chart object in the objectModel. |
setXMLFile | Method | Sets chart XML configuration file path. |
write | Method | Adds the chart to HTML DOM as a child of the specified container. |
onChartDraw | Event | This event is dispatched when the AnyChart Stock is drawn. |
Prerequisites
This section lists all configuration, data and auxiliary files required for this sample.
Configuration file
CSV files
SWF files
- AnyChartStock.swf - AnyChart Stock component.
- Preloader.swf - AnyChart Stock helper component that loads the main component (AnyChartStock.swf) and displays loading progress.
JavaScript Libraries
- jquery-1.4.2.min.js - A JavaScript jQuery library. Learn more at jQuery official site.
- jquery-ui-1.8.1.custom.min.js - A JavaScript UI library - a jQuery addon that helps to work with a calendar.
- AnyChartStock.js - A JavaScript library that is shipped with AnyChart Stock component. It is used to embed the component into HTML DOM and to comunicate with the Flash part.
Additional Files
The information contained in this website is for general information purposes only. All sample data provided on this site is for demonstration purposes only.
The logos and names of other companies and products mentioned on this site are copyright and/or trademarks of their respective owners.
The content on this site, including news, quotes, data and other information, is provided for your personal information only, and is intended for demonstration purposes only. Content on this site is not appropriate for the purposes of making a decision to carry out a transaction or trade. Nor does it provide any form of advice (investment, tax, legal) amounting to investment advice, or make any recommendations regarding particular financial instruments, investments or products.
In no event AnyChart will be liable for any loss or damage including without limitation, indirect or consequential loss or damage, or any loss or damage whatsoever arising from loss of data or profits arising out of, or in connection with, the use of this website.
This site may point to other Internet sites that may be of interest to you, however AnyChart does not endorse or take responsibility for the content on such other sites
Market data and News provided by and copyright RediNews, Incorporated.