<html>
	<head>
		<title>Using HTML Tooltips for Event Markers</title>
		<meta http-equiv="content-type" content="text/html; charset=UTF-8"/>
		<script type="text/javascript" language="javascript" src="./../js/AnyChartStock.js?v=1.9.0r9317"></script>
		<!---
			This sample uses jquery library to work with DOM
		-->
		<script type="text/javascript" language="javascript" src="./js/jquery.min.js"></script>

		<style type="text/css">

			/* chart size */
			#chartContainer {
				width: 800px;
				height: 400px;
			}

			/* tooltip and other elements style */
			html,body  {
				padding: 0;
				margin: 0;
			}

			div#tooltip {
				background-color: #FFFFFF;

				border-style: solid;
				border-width: 1px;
				border-color: #AFAFAF;

				padding: 0px;

				width: 215px;
				height: auto;

				position: absolute; /* this parameter is required to show tooltip in proper place */
				display: none;

				font-family: Arial;
			}

			#tooltipHead {
				background-color: #858585;
				color: #FFFFFF;
				font-weight: bold;
				width: auto;
				height: auto;
				padding: 3px;
				padding-left: 12px;
				font-size: 11px;
			}

			#tooltipContent {
				color: rgb(20,20,20);
				font-size: 11px;
				overflow-y: scroll;
				height: 135px;
				padding-left: 0;
			}

			#tooltipContent ul {
				padding-left: 20px;
				margin:0;
				list-style:outside disc;
			}
			#tooltipContent ul li{padding:0;margin:0;}


			#tooltipContent span {
				font-size: 9px;
				color: rgb(150, 150, 150);
			}

			table.settings {
				border-style: solid;
				border-width: 1px;
				border-color: #D0CDC9;
			}

			table.settings tr th {
				font:normal 60% Verdana;
				background-color: #DCD9D5;
				font-weight:bold;
				padding-bottom:5px;
				padding-top:5px;
				padding-left:10px;
				text-align:left;
			}
			table.settings tr td {
				background-color: #F8F4F0;
				font:normal 70% Verdana;
				padding-bottom:2px;
				padding-top:2px;
				padding-left:10px;
				text-align:left;
			}
		</style>
		<script type="text/javascript" language="javascript">
			// Creating new chart object.
			var chart = new AnyChartStock("./../swf/AnyChartStock.swf?v=1.9.0r9317", "./../swf/Preloader.swf?v=1.9.0r9317");
			// Setting XML config file.
			chart.setXMLFile("config.xml");
			// Background color.
			chart.bgColor = "#F8F4F0";
			// wmode is set to opaque to show HTML tooltip above the chart.
			chart.wMode = "opaque";
			// Writing the flash object into the page DOM.
			chart.write("chartContainer");

			//--------------------------------------------------------------------------------
			//		Date time formatting
			//--------------------------------------------------------------------------------

			var monthNames = ["January", "February", "March", "April", "May", "June", "July", "August", "September", "October", "November", "December"];

			// Format datetime. Mask is %dd %MMMM %yyyy. e.g. 22 January 1987
			function formatDate(date) {
				return date.getDate() + " " + monthNames[date.getMonth()] + " " + date.getFullYear();
			}

			//--------------------------------------------------------------------------------
			//		Tooltip
			//--------------------------------------------------------------------------------

			// create list item for event marker tooltip
			function createMarkerTooltipContent(eventMarker, addLi) {
				var res = addLi ? "<li>" : "";
				res += "<a href=\""+eventMarker.customAttributes.Link+"\" target=\"_blank\">"+eventMarker.customAttributes.Title+"</a>";
				res += "<br />";
				res += "<span>"+formatDate(eventMarker.date)+"</span>";
				res += addLi ? "</li>" : ""
				return res;
			}

			// Function to show tooltip
			function showMarkerTooltip(eventMarker) {
				clearTimeout(showTimeout); // clear show timeout
				clearTimeout(hideTimeout); // and hide timeout

				// show tooltip in a millisecond after mouse over event marker
				showTimeout = setTimeout(function(){
					var eventMarkerLeft = Number(eventMarker.bounds.x);
					var eventMarkerTop = Number(eventMarker.bounds.y);

					// get chart offset
					var offset = $(chart.target).offset();
					// and event event marker position
					eventMarkerLeft += offset.left + 9;
					eventMarkerTop += offset.top;

					// adjust tooltip position
					$("#tooltip").css("left",(eventMarkerLeft < 230) ? (eventMarkerLeft + eventMarker.bounds.width - 1) : (eventMarkerLeft - 212));
					$("#tooltip").css("top",eventMarkerTop);

					// and show tooltip
					$("#tooltip").css("display","block");
				},1);
			}

			var isTooltipHovered = false;
			var showTimeout;
			var hideTimeout;

			// Function to show simple (non-merged) event marker tooltip
			function showSimpleTooltip(eventMarker) {
				// adjust position and show tooltip
				showMarkerTooltip(eventMarker);
            	// set tooltip header
				$("#tooltipHead").html("Key Development:<br />" + formatDate(eventMarker.date));
				// and tooltip content
				$("#tooltipContent").html(createMarkerTooltipContent(eventMarker, false));
				$("#tooltipContent").css("height","auto");
				$("#tooltipContent").css("overflow-y","auto");
				$("#tooltipContent").css("margin","10px");
			}

			// Function to show tooltip for merged event markers
			function showMergedTooltip(eventMarkers) {
				// adjust position and show tooltip according to  event marker with zero index (all merged event markers have the same coordinates)
				showMarkerTooltip(eventMarkers[0]);

				var count = eventMarkers.length;

				// show dates range in header, using data about first and last merged event markers
				var startDate = formatDate(eventMarkers[0].date);
				var endDate = formatDate(eventMarkers[count - 1].date);

				if (startDate != endDate)
					$("#tooltipHead").html("(" + count.toString() + ") Key Developments:<br />" + startDate + " - " + endDate);
				else
					$("#tooltipHead").html("(" + count.toString() + ") Key Developments:<br />" + startDate);

				// get the data from all merged event markers
				var content = "<ul>";
				for (var i = 0; i < count; i++) {
				    content += createMarkerTooltipContent(eventMarkers[i], true);
				}
				content += "</ul>";
				$("#tooltipContent").html(content);
				$("#tooltipContent").css("height","135px");
				$("#tooltipContent").css("overflow-y","scroll");
				$("#tooltipContent").css("margin","0");
			}

			// Function to hide tooltips
			function hideTooltip() {
				clearTimeout(hideTimeout); // clear previous timeout
				// and hide tooltip in a millisecond after in is hovered
				hideTimeout = setTimeout(function(){
					if (isTooltipHovered) return;
					$("#tooltip").css("display","none");
				}, 1);
			}

			//--------------------------------------------------------------------------------
			//		Events handling
			//--------------------------------------------------------------------------------

			// eventMarkerMouseOver handler
			chart.onEventMarkerMouseOver = function(eventMarker) {
				//show simple tooltip for one event marker
				showSimpleTooltip(eventMarker);
			};

			// mergedEventMarkerMouseOver handler
			chart.onMergedEventMarkerMouseOver = function(eventMarkers) {
				//show tooltip for merged event markers
				showMergedTooltip(eventMarkers);
			};

			// eventMarkerMouseOut and mergedEventMarkerMouseOut events handling
			chart.onEventMarkerMouseOut = chart.onMergedEventMarkerMouseOut = function() {
				// hide tooltip
				hideTooltip();
			};

			//--------------------------------------------------------------------------------
			//		Tooltip hover
			//--------------------------------------------------------------------------------

			// Wait till the moment DOM is ready
			$(document).ready(function() {
				$("#tooltip").hover(function() {
										// when tooltip is hovered - set isTooltipHovered to true, thus disallowing it to be hidden
										isTooltipHovered = true;
										// disable chart interactivity (to avoid focus problems in Safari browser)
										chart.disableInteractivity();
									}, function() {
										// when mouse leaves tooltip, set isTooltipHovered to false, allowing tooltip to be hidden
										isTooltipHovered = false;
										// and enable interactivity
										chart.enableInteractivity();
										// finally hide the tooltip
										hideTooltip();
									});
			});
		</script>
	</head>
	<body>
		<table class="settings">
			<tr>
			  <th>Hover Event Markers to see HTML tooltip with hyperlinked text.</th>
			</tr>
			<tr>
				<td id="chartContainer"><!-- Chart Container --></td>
			</tr>
		</table>

		<!--
			HTML tooltip container goes below.
			It is added at the very bottom of the page to avoid Z-index issues.
		-->
		<div id="tooltip">
			<div id="tooltipHead">Head</div>
			<div id="tooltipContent">content</div>
		</div>
	</body>
</html>
Sample Description
How to use this sample?
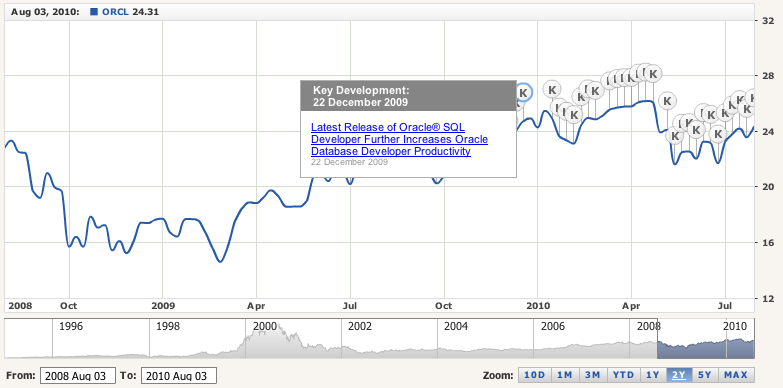
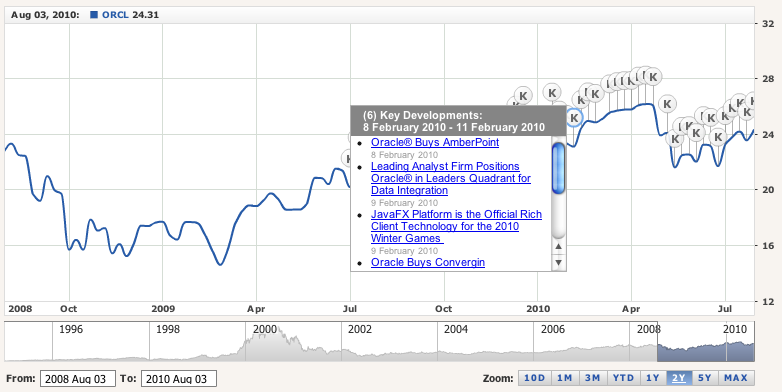
Hover any event marker to see custom HTML tooltip with event information. When data grouping level changes
and several event markers are grouped in one - the information is shown in one tooltip. All event information comes
from config.xml.

How it works
Besides the internal event marker tooltips, you can create HTML-based tooltips using mouse events and some special AnyStock functions.
In this sample HTML-based tooltips are created and two event marker events are handled: onEventMarkerMouseOver and onEventMarkerMouseOut - the first one triggers creation of custom HTML tooltip and the second one hides it.
HTML tooltip itself is just a simple div element, that is dynamically populated with data, that is obtained from eventMarker object, that comes from onEventMarkerMouseOver event.
Note, that if user hovers single event tooltip shows information from one event marker:
And if merged event marker is hovered - tooltips aggregates information from several event markers and shows date range in title and several rows with events info:
Another thing, that should be mentioned is the way custom tooltip is shown and hidden: take a closer look at showMarkerTooltip and hideTooltip functions to see that tooltips are placed with a small offset to avoid flickering on show and hidden with a small timeout for the same purpose.
You can read more about custom event marker tooltips at: HTML Tooltips for Event Markers article.
AnyChartStock JavaScript API
This sample uses the following methods, properties and events from AnyChartStock JavaScript API:
| Item |
Type |
Description |
| bgColor |
Property (HEX Color String ) |
Flash movie background color.
|
| target |
Property (DOM Object) |
Link to a chart container DOM object. |
| wMode |
Property (String) |
Sets the Window Mode property of the Flash movie for transparency, layering, and positioning in the browser.
|
| disableInteractivity |
Method |
Disables chart interactivity. |
| enableInteractivity |
Method |
Enables chart interactivity, if it is disabled by disableInteractivity() method. |
| setXMLFile |
Method |
Sets chart XML configuration file path.
|
| write |
Method |
Adds the chart to HTML DOM as a child of the specified container.
|
| onEventMarkerMouseOut |
Event |
This event is dispatched when the mouse leaves an event marker. |
| onEventMarkerMouseOver |
Event |
This event is dispatched when an event marker is hovered by the mouse. |
| onMergedEventMarkerMouseOut |
Event |
This event is dispatched when the mouse leaves a merged event marker group. |
| onMergedEventMarkerMouseOver |
Event |
This event is dispatched when the user hovers a merged event marker group. |
Prerequisites
This section lists all configuration, data and auxiliary files required for this sample.
Configuration file
CSV files
SWF files
- AnyChartStock.swf - AnyChart Stock component.
- Preloader.swf - AnyChart Stock helper component that loads the main component (AnyChartStock.swf) and displays loading progress.
JavaScript Libraries
- jquery.min.js - A JavaScript jQuery library. Learn more at jQuery official site.
- AnyChartStock.js - A JavaScript library that is shipped with AnyChart Stock component. It is used to embed the component into HTML DOM and to comunicate with the Flash part.
The information contained in this website is for general information
purposes only. All sample data provided on this site is for
demonstration purposes only.
The logos and names of other companies and products mentioned on this
site are copyright and/or trademarks of their respective owners.
The content on this site, including news, quotes, data and other
information, is provided for your personal information only, and is
intended for demonstration purposes only. Content on this site is not
appropriate for the purposes of making a decision to carry out a
transaction or trade. Nor does it provide any form of advice
(investment, tax, legal) amounting to investment advice, or make any
recommendations regarding particular financial instruments, investments
or products.
In no event AnyChart will be liable for any loss or damage including
without limitation, indirect or consequential loss or damage, or any
loss or damage whatsoever arising from loss of data or profits arising
out of, or in connection with, the use of this website.
This site may point to other Internet sites that may be of interest to
you, however AnyChart does not endorse or take responsibility for the
content on such other sites
Market data and News provided by and copyright RediNews, Incorporated.