<html>
<head>
<title>Chart Mouse Events Handling</title>
<meta http-equiv="content-type" content="text/html; charset=UTF-8" />
<!---
This sample uses jquery library to work with DOM
-->
<script type="text/javascript" language="javascript" src="./js/jquery.min.js"></script>
<script type="text/javascript" language="javascript" src="./../js/AnyChartStock.js?v=1.9.0r9317"></script>
<!-- chart size settings -->
<style type="text/css">
#chartContainer {
width: 500px;
height: 350px;
}
</style>
<script type="text/javascript" language="javascript">
// Creating new chart object.
var chart = new AnyChartStock("./../swf/AnyChartStock.swf?v=1.9.0r9317", "./../swf/Preloader.swf?v=1.9.0r9317");
// Setting XML config file.
chart.setXMLFile("config.xml");
// Set wmode to opaque allows to show HTML elements above the component
chart.wMode = "opaque";
// Set background color
chart.bgColor = "#AADDAA";
// Writing the flash object into the page DOM.
chart.write("chartContainer");
//--------------------------------------------------------------------------------
// Auxiliary Functions
//--------------------------------------------------------------------------------
var tooltip; // link to <div id="tooltip" />, which is used to show tooltip.
var detailsEventType; // link to <td id="detailsFieldEventType" />, to show event type.
var detailsChartId; // link to <td id="detailsFieldChartID" />, to show chart id.
var detailsTimestamp; // link to <td id="detailsFieldTimestamp" />, to show date.
var detailsMouseX; // link to <td id="detailsFieldMouseX" />, to show mouse x value relative to flash player left-top corner.
var detailsMouseY; // link to <td id="detailsFieldMouseY" />, to show mouse y value relative to flash player left-top corner.
// using jquery get DOM ready state and obtain links listed above
$(document).ready(function() {
tooltip = $("#tooltip");
detailsEventType = $("#detailsFieldEventType");
detailsChartId = $("#detailsFieldChartID");
detailsTimestamp = $("#detailsFieldTimestamp");
detailsMouseX = $("#detailsFieldMouseX");
detailsMouseY = $("#detailsFieldMouseY");
});
// Events Logging Routines
var events = [];
function logEvent(type, info) {
events.push(type);
if (events.length > 10)
events = events.splice(1);
for (var i = 0;i<events.length;i++) {
var e = events[events.length-1-i];
var rowIndex = (i+1).toString();
$("table.log tr:eq("+rowIndex+") td").html(e);
}
}
/*
Function to show event information
type {String} event type
chartId {String} id of the chart, which fires the event
date {Date} date
mouseX {Number} x mouse coordinate (relative to swf)
mouseY {Number} y mouse coordinate (relative to swf)
*/
function showEventDetails(type, chartId, date, mouseX, mouseY) {
detailsEventType.html(type);
detailsChartId.html(chartId);
detailsTimestamp.html(date.toDateString());
detailsMouseX.html(mouseX);
detailsMouseY.html(mouseY);
}
// Function to show tooltip
function showTooltip() {
tooltip.css("display","block");
}
// Function to hide tooltip
function hideTooltip() {
tooltip.css("display","none");
}
// Toopltip positioning and text update
function updateTooltip(mouseX, mouseY) {
// round
mouseX = Math.round(mouseX*100)/100;
mouseY = Math.round(mouseY*100/100);
/*
NOTE:
chart.target - link to DOM element, in which component is embedded
$(chart.target).offset() - absolute offset of the element on the page
*/
var offset = $(chart.target).offset();
// Sum element offset with mouse offset inside the component. Position value comes from events.
// Also we add 7 pixels, movinf html tooltip a bit, to avoid focus/unfocus problems
// (withot this addition offset mouse goes to tooltip and component looses focus)
offset.left += mouseX+13;
offset.top += mouseY+13;
// update tooltip position
tooltip.css("left",offset.left+"px");
tooltip.css("top",offset.top+"px");
// update tooltip text
tooltip.html("HTML page coords: { x:"+offset.left+", y:"+offset.top+" }<br />"+
"Flash player coords: { x:" + mouseX + ", y:" + mouseY + " }");
}
//--------------------------------------------------------------------------------
// Mouse over
//--------------------------------------------------------------------------------
// listen to onChartMouseOver event
chart.onChartMouseOver = function(chartId, date, mouseX, mouseY) {
// show tooltip
showTooltip();
// update tooltip position
updateTooltip(mouseX, mouseY);
// log the event
logEvent("onChartMouseOver");
// show event details
showEventDetails("onChartMouseOver",chartId, date, mouseX, mouseY);
};
//--------------------------------------------------------------------------------
// Mouse out
//--------------------------------------------------------------------------------
// listen to onChartMouseOut event
chart.onChartMouseOut = function(chartId, date, mouseX, mouseY) {
// hide tooltip
hideTooltip();
// log the event
logEvent("onChartMouseOut");
// show event details
showEventDetails("onChartMouseOut", chartId, date, mouseX, mouseY);
};
//--------------------------------------------------------------------------------
// Mouse move
//--------------------------------------------------------------------------------
// listen to onChartMouseMove event
chart.onChartMouseMove = function(chartId, date, mouseX, mouseY) {
// log the event
logEvent("onChartMouseMove");
// show event details
showEventDetails("onChartMouseMove", chartId, date, mouseX, mouseY);
// update tooltip position
updateTooltip(mouseX, mouseY);
};
//--------------------------------------------------------------------------------
// Mouse up
//--------------------------------------------------------------------------------
// listen to onChartMouseUp
chart.onChartMouseUp = function(chartId, date, mouseX, mouseY) {
// log the event
logEvent("onChartMouseUp");
// show event details
showEventDetails("onChartMouseUp", chartId, date, mouseX, mouseY);
// update tooltip position
updateTooltip(mouseX, mouseY);
};
//--------------------------------------------------------------------------------
// Mouse down
//--------------------------------------------------------------------------------
// listen to onChartMouseDown event
chart.onChartMouseDown = function(chartId, date, mouseX, mouseY) {
// log the event
logEvent("onChartMouseDown");
// show event details
showEventDetails("onChartMouseDown", chartId, date, mouseX, mouseY);
// update tooltip position
updateTooltip(mouseX, mouseY);
};
</script>
<!-- log, tooltip and other elements style settings -->
<style type="text/css">
#log {
height: 200px;
width: 220px;
border-color: #000000;
border: 1px solid #999999;
}
#tooltip {
position: absolute; /* this parameter is required to show tooltips in proper place */
left: 0;
top: 0;
border: 1px solid #505050;
background-color: White;
display: block;
padding: 5px;
font-size: 9px;
font-family: Verdana;
font-weight: bold;
color: #333333;
line-height: 13px;
display: none;
}
table tr {
vertical-align: top;
}
table.settings {
border-style: solid;
border-width: 1px;
border-color: #D0CDC9;
}
table.settings tr th {
font:normal 60% Verdana;
background-color: #DCD9D5;
font-weight:bold;
padding-bottom:5px;
padding-top:5px;
padding-left:10px;
text-align:left;
}
table.settings tr td {
background-color: #F8F4F0;
font:normal 70% Verdana;
padding-bottom:2px;
padding-top:2px;
padding-left:10px;
text-align:left;
}
table.info {
width: 260px;
}
table.offsets td {
font-weight: bold !important;
vertical-align: middle !important;
text-align: center !important;
}
</style>
</head>
<body>
<table>
<tr valign="top">
<td>
<table class="settings">
<tr>
<th colspan="2">Move mouse or click over chart plot area to fire events:</th>
</tr>
<tr>
<td colspan="2">
<table class="offsets" cellspacing="0" cellpadding="0">
<tr>
<td colspan="2"></td>
<td bgcolor="#66ffcc">(TOP OFFSET)<br/><img src="./offset_top_icon.png" width="67" height="49"></td>
</tr>
<tr>
<td valign="middle" bgcolor="#66ffcc">(LEFT OFFSET)</td>
<td valign="middle" bgcolor="#66ffcc"><img src="./offset_left_icon.png" width="49" height="67">
<td id="chartContainer"><!-- Chart Container --></td>
</tr>
</table>
</td>
</tr>
</table>
</td>
<td>
<table class="settings info log">
<tr><th>Events Log:</th></tr>
<tr><td> </td></tr>
<tr><td> </td></tr>
<tr><td> </td></tr>
<tr><td> </td></tr>
<tr><td> </td></tr>
<tr><td> </td></tr>
<tr><td> </td></tr>
<tr><td> </td></tr>
<tr><td> </td></tr>
</table>
<br />
<table class="settings info">
<tr>
<th colspan="2">Last event info:</th>
</tr>
<tr>
<td width="90">Type:</td>
<td id="detailsFieldEventType"></td>
</tr>
<tr>
<td>Chart ID:</td>
<td id="detailsFieldChartID"></td>
</tr>
<tr>
<td>Timestamp:</td>
<td id="detailsFieldTimestamp"></td>
</tr>
<tr>
<td>Mouse X:</td>
<td id="detailsFieldMouseX"></td>
</tr>
<tr>
<td>Mouse Y:</td>
<td id="detailsFieldMouseY"></td>
</tr>
</table>
</td>
</tr>
</table>
<!--
html tooltip container goes below
it is added at the very botttom of the page to avoid z index issues
-->
<div id="tooltip"></div>
</body>
</html>
Sample Description
How to use this sample?
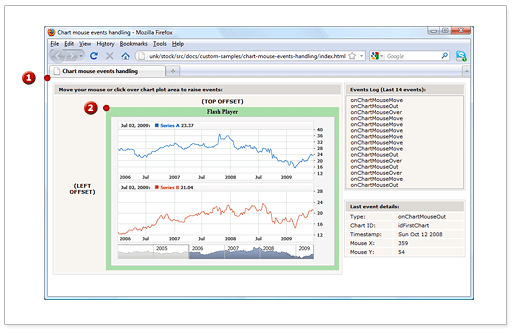
Move mouse over or click chart plot area to fire events. Event details are shown on Event Log table shown to the right of the chart.

How it works
The AnyChart Stock component supports over 20 different types of events for for all occasions. These events can be obtained from the component and then handled with the AnyChartStock class, an object of which is bound to the Flash Player when embedding a chart in a page.
For each event, the AnyChartStock class has a special property, which is also a link to the event handler function. Event handlers can be set inline or by setting the handler function name to the corresponding property.
This sample shows the mouse events handling in AnyChart Stock. Several event handlers are set (full list available below) and all handlers are used only to show information in Event Log table. These events are pretty important for they are used widely in other samples to create custom HTML tooltips and other nice things, so we need to highlight several topics:
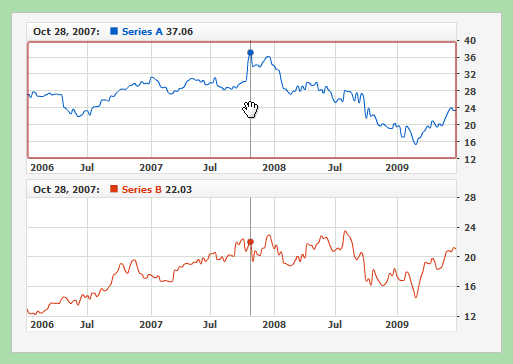
Event Source Area
These mouse events are dispatched when user moves the mouse over the plotting areas only, illustration below highlights one of two plotting areas:
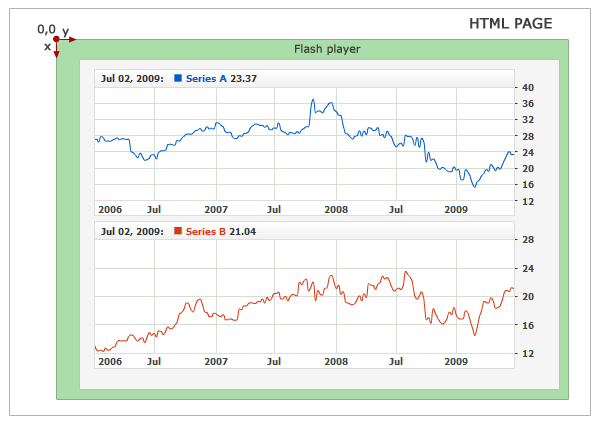
Offsets and Coordinates
When you work with (x,y) coordinates in HTML page and AnyChart Stock you should understand that there are two (0,0) points:
 HTML (0,0) point, coordinates start on the page, from this point all absolute coordinates on the page are calculated.
  AnyChart Stock Flash (0,0) point, coordinate start in the component, all (x,y) coordinates you get in mouse events are calculated from this point.
We have intentionally added and marked top and left offsets on the page, so you could see, that these (0,0) points are different. The coordinates are
counted top to bottom and left to right both on the page and in the AnyChart Stock Component, as shown below:
Knowing this you can always place any element above the AnyChart Stock Chart in the desired place, this technique, for example, is used in
HTML Tooltips for event markers sample.
You can learn everything you need to know about handling events and find full list of available events and handling guide in Events Handling article.
AnyChartStock JavaScript API
This sample uses the following methods, properties and events from AnyChartStock JavaScript API:
| Item |
Type |
Description |
| bgColor |
Property (HEX Color String ) |
Flash movie background color.
|
| target |
Property (DOM Object) |
Link to a chart container DOM object. |
| wMode |
Property (String) |
Sets the Window Mode property of the Flash movie for transparency, layering, and positioning in the browser.
|
| setXMLFile |
Method |
Sets chart XML configuration file path.
|
| write |
Method |
Adds the chart to HTML DOM as a child of the specified container.
|
| onChartMouseDown |
Event |
This event is dispatched when the mouse button is pressed on the chart plotting area. |
| onChartMouseMove |
Event |
This event is dispatched when the mouse is moving over the chart plotting area. |
| onChartMouseOut |
Event |
This event is dispatched when the mouse leaves the chart plotting area. |
| onChartMouseOver |
Event |
This event is dispatched when the chart plotting area is hovered by the mouse. |
| onChartMouseUp |
Event |
This event is dispatched when the mouse button is released. |
Prerequisites
This section lists all configuration, data and auxiliary files required for this sample.
Configuration file
CSV files
SWF files
- AnyChartStock.swf - AnyChart Stock component.
- Preloader.swf - AnyChart Stock helper component that loads the main component (AnyChartStock.swf) and displays loading progress.
JavaScript Libraries
- jquery.min.js - A JavaScript jQuery library. Learn more at jQuery official site.
- AnyChartStock.js - A JavaScript library that is shipped with AnyChart Stock component. It is used to embed the component into HTML DOM and to comunicate with the Flash part.
Additional Files