Real-Time Data Streaming and Data Manipulations
- Overview
- Data Manipulation Methods
- Adding, Insertion and Update
- Single Point Removal
- Removal of the Range
- Note on Data Update and Technical Indicators
Overview
AnyChart Stock component gives you the ability to add, remove or modify data points in real-time without full chart reloading and redrawing - you can do just what you need in a fast and flexible way.
Several easy to use Java Script methods allow you to solve the following tasks:
- Data-Streaming - adding new points with new data to the end of one or several data sets with optional ability to remove some points from the beginning of the data set.
- Updating - you can change the values of the existing points.
- Insertion - you can add one or several points between some existing points.
- Removing - you can remove on point by the given timestamp or several points by the given range.
This article shows how to solve each of this tasks and features examples for all methods described.
![]()
Data Manipulation Methods
AnyChartStock class from AnyChartStock JavaScript library contains the following data manipulation methods:
| Method | Description |
|---|---|
| appendData(dataSetId:String, csvData:String [, removeCount:int]); | Appends given number of rows to the given data set. Optionally removes given number of points from the beginning of the data set. Affects the chart only when commitDataChanges() is fired. |
| removeDataRow(dataSetId:String, date:Date); | Removes one row from the given data set by the given timestamp. Affects the chart only when commitDataChanges() is fired. |
| removeDataRange(dataSetId:String, startDate:Date, endDate:Date); | Removes all rows from the given data set that fall into the given range. Affects the chart only when commitDataChanges() is fired. |
| commitDataChanges(); | Applies changes made by methods appendData(), removeDataRow() and removeDataRange() to the chart. |
As you can see - for appendData(), removeDataRow() and removeDataRange() methods you should specify id of the data set you want to change, which means that one call of each method changes only one data set, and they should be called several times to change several data sets.
All data manipulation methods are based on deferred application principle that allows to make several modifications in one or several data sets and then apply them at one time using commitDataChanges() method.
Data Modification Case Study
To understand better what is the best way to organize data changes we will now study the following case:
1. Source data
- Three data series are shown on the chart.
- Each series is based on separate data set.
2. Task
The following features should be implemented:
- Cmd 1 - Add 30 new points into the end of each data set.
- Cmd 2 - Remove 30 points from the beginning and add 30 points to the end of each data set.
- Cmd 3 - Remove all points from all data sets and populate them with new random data.
3. Requirements:
- After each Cmd the chart should be updated.
- Chart update time should be comparable for each Cmd.
4. Solution:
Obviously you need to group operations to solve these tasks - and that's the place when commitDataChanges() method comes in scene.
For each Cmd we will do certain set of appendData(), removeDataRow() and removeDataRange() for one or several data sets and then call commitDataChanges() to apply modifications.
Live sample below shows all the commands described and satisfies the proposed requirements:
Caution: you should carefully consider operations grouping, because mistakes in this may lead to dramatic performance decrease.
![]()
Adding, Insertion and Update
This section describes and explains how points should be added, inserted and updated.
appendData() method
appendData() can either add and insert data points, and also it can be used to update existing data points.
In effect this method merges two data tables - the first one is data set, and the second one is passed as method argument. Merging logics is described in Logic Principles section.
appendData method has the following parameters:
- dataSetId - the id of the data set it works with. For example, if we have <data_set id="dsMyDataSet1">, and want to add data we need to write: .appendData("dsMyDataSet1",.....);
- csvData - CSV table with one or several rows that will be merged with the given data set. CSV table should follow the rules described in CSV Format Rules section .
- removeCount - optional parameter that specifies the number of rows to be removed from the beginning of the data set. This parameter is especially useful when you implement data streaming - you can add and remove the same quantity of data points using one command and keep the number of points displayed constant.
![]()
CSV Format Rules
CSV format of the table passed to appendData() should match the format of the table used in data set you operate with.
Formally, the following rules must be observed:
- Timestamp column format should be the same.
- The number of columns and their order should be the same.
- Column and row separators should be the same.
- The table passes to the method must not have the header row.
Sample 1. Data set contains daily data. CSV table uses non-default row separator:

01 |
<data_set id="ds1" source_mode="InternalData" date_time_column="0"> |
02 |
<csv_settings ignore_first_row="false" rows_separator=";" columns_separator="," /> |
03 |
<locale> |
04 |
<date_time> |
06 |
</date_time> |
07 |
</locale> |
09 |
</data_set> |
01 | { |
02 | id: "ds1", |
03 | sourceMode: "InternalData", |
04 | dateTimeColumn: 0, |
05 | csvSettings: { |
06 | ignoreFirstRow: false, |
07 | rowsSeparator: ";", |
08 | columnsSeparator: "," |
09 | }, |
10 | locale: { |
11 | dateTime: { |
12 | format: "%dd.%MM.%yyyy" |
13 | } |
14 | }, |
15 | csvData: "08.04.2010,63.5;09.04.2010,57.8;10.04.2010,54.9" |
16 | } |
To add new rows you should write:
Sample 2. Data set contains data with minutes precision:
01 |
<data_set id="ds1" source_mode="InternalData" date_time_column="0"> |
02 |
<csv_settings ignore_first_row="false" rows_separator="\n" columns_separator="," /> |
03 |
<locale> |
04 |
<date_time> |
06 |
</date_time> |
07 |
</locale> |
08 |
<csv_data><![CDATA[08.04.2010 13:31,63.5 |
09 |
08.04.2010 13:32,57.8 |
10 |
08.04.2010 13:33,54.9]]></csv_data> |
11 |
</data_set> |
01 | { |
02 | id: "ds1", |
03 | sourceMode: "InternalData", |
04 | dateTimeColumn: 0, |
05 | csvSettings: { |
06 | ignoreFirstRow: false, |
07 | rowsSeparator: "\n", |
08 | columnsSeparator: "," |
09 | }, |
10 | locale: { |
11 | dateTime: { |
12 | format: "%dd.%MM.%yyyy %HH:%mm" |
13 | } |
14 | }, |
15 | csvData: "08.04.2010 13:31,63.5\r\n08.04.2010 13:32,57.8\r\n08.04.2010 13:33,54.9" |
16 | } |
To add new rows you should write:
![]()
Logic Principles
Logic of appendData() is very simple: it merges data set with the table specified in csvData argument, and then the resulting table is used by the component.
To make further text more clear we will introduce two definitions:
- Source Table - table specified in csvData parameter in appendData() call.
- Destination Table - table specified in data set we operate with, and which id is set in dataSetId argument of appendData().
Tables are merged according to the following principles (we are speaking now about one row of Source Table):
- If there is no row with timestamp from the Source Table in the Destination Table - the new row is inserted into the Destination Table.
- If there is a row with the same timestamp in the Destination Table - the row in the Destination Table is replaced with the row from the Source Table.
Sample
To understand the logic even better we will now describe the merging process in details.
If the Source Table looks like this:
| Timestamp | Open | High | Low | Close |
|---|---|---|---|---|
| 08.04.2010 13:30:00 | 62.4 | 74.8 | 60.8 | 74.3 |
| 08.04.2010 13:34:00 | 60.4 | 60.4 | 54.2 | 55.3 |
| 08.04.2010 13:35:00 | 59.7 | 61.6 | 58.8 | 61.0 |
| 08.04.2010 13:37:30 | 58.3 | 61.9 | 59.2 | 57.3 |
| 08.04.2010 13:42:00 | 47.9 | 49.5 | 46.2 | 46.8 |
| 08.04.2010 13:43:00 | 48.8 | 48.9 | 47.0 | 48.3 |
And the Destination Table looks like this:
| Timestamp | Open | High | Low | Close |
|---|---|---|---|---|
| 08.04.2010 13:31:00 | 63.5 | 76.7 | 62.8 | 76.7 |
| 08.04.2010 13:32:00 | 57.8 | 63.2 | 57.8 | 63.2 |
| 08.04.2010 13:33:00 | 54.9 | 58.8 | 52.9 | 57.9 |
| 08.04.2010 13:34:00 | 60.4 | 60.4 | 54.2 | 55.3 |
| 08.04.2010 13:35:00 | 59.7 | 61.6 | 58.8 | 61.0 |
| 08.04.2010 13:36:00 | 58.8 | 63.5 | 58.3 | 59.6 |
| 08.04.2010 13:37:00 | 57.9 | 60.9 | 57.9 | 58.5 |
| 08.04.2010 13:38:00 | 63.2 | 63.9 | 57.9 | 58.2 |
| 08.04.2010 13:39:00 | 64.8 | 66.4 | 64.4 | 64.6 |
| 08.04.2010 13:40:00 | 51.7 | 64.6 | 51.7 | 64.4 |
| 08.04.2010 13:41:00 | 47.1 | 51.0 | 44.2 | 51.0 |
Then, according to the rules described above, the resulting table, where:
- rows in red are rows inserted into the Destination Table from the Source Table,
- rows in green are rows, which were replaced,
Looks like this:
| Timestamp | Open | High | Low | Close |
|---|---|---|---|---|
| 08.04.2010 13:30:00 | 62.4 | 74.8 | 60.8 | 74.3 |
| 08.04.2010 13:31:00 | 63.5 | 76.7 | 62.8 | 76.7 |
| 08.04.2010 13:32:00 | 57.8 | 63.2 | 57.8 | 63.2 |
| 08.04.2010 13:33:00 | 54.9 | 58.8 | 52.9 | 57.9 |
| 08.04.2010 13:34:00 | 60.4 | 60.4 | 54.2 | 55.3 |
| 08.04.2010 13:35:00 | 59.7 | 61.6 | 58.8 | 61.0 |
| 08.04.2010 13:36:00 | 58.8 | 63.5 | 58.3 | 59.6 |
| 08.04.2010 13:37:00 | 57.9 | 60.9 | 57.9 | 58.5 |
| 08.04.2010 13:37:30 | 58.3 | 61.9 | 59.2 | 57.3 |
| 08.04.2010 13:38:00 | 63.2 | 63.9 | 57.9 | 58.2 |
| 08.04.2010 13:39:00 | 64.8 | 66.4 | 64.4 | 64.6 |
| 08.04.2010 13:40:00 | 51.7 | 64.6 | 51.7 | 64.4 |
| 08.04.2010 13:41:00 | 47.1 | 51.0 | 44.2 | 51.0 |
| 08.04.2010 13:42:00 | 47.9 | 49.5 | 46.2 | 46.8 |
| 08.04.2010 13:43:00 | 48.8 | 48.9 | 47.0 | 48.3 |
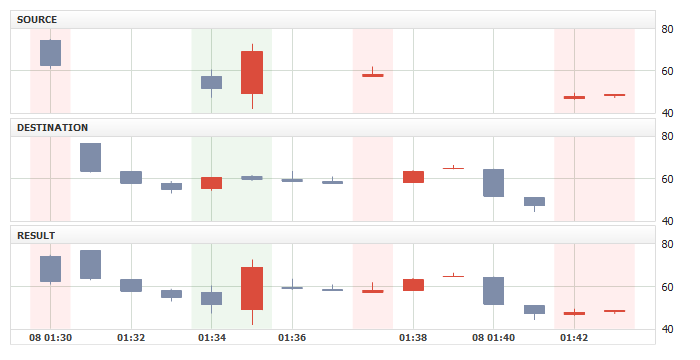
We can visualize all three tables: the chart below shows (top-down) Source, Destination and Result tables:
![]()
Usage Samples
This section features samples of the appendData() use in different situations.
Sample 1. Adding new points to the end of one data set, with simultaneous removal of the same number from the beginning:
Sample 2. Adding new points to the end of several data sets, with simultaneous removal of the same number from the beginning of each data set:
Sample 3. Insertion of several points:
Sample 4. Total update of all points in the data set:
Sample 5. Update of some points in the data set:
Sample 6. Update of the last point and adding new points at the same time:
![]()
Single Point Removal
To remove one point (row) from the data set you should use
where:
- dataSetId - the id of the data set from which the point is removed,
- date - JS Date instance with timestamp of the row to be removed.
If there is a row with date timestamp in the data set, then it is removed, if there is no such row - nothing happens.
![]()
Removal of the Range
If you need to remove several points according to the defined time range use
where:
- dataSetId - the id of the data set from which the points are removed,
- startDate - JS Date instance with the start of the range,
- endDate - JS Date instance with the end of the range.
The method removes all rows which timestamps fall in startDate to endDate range. If no points fall in range - nothing happens.
![]()
Note on Data Update and Technical Indicators
When you change anything in the data sets: add, remove or alter points and there are technical indicators based on these data - these indicators are automatically recalculated basing on the new data.
The sample below shows data streaming with technical indicators involved:
![]()