01 | { |
02 | scroller: { |
03 | enabled: false |
04 | } |
05 | } |
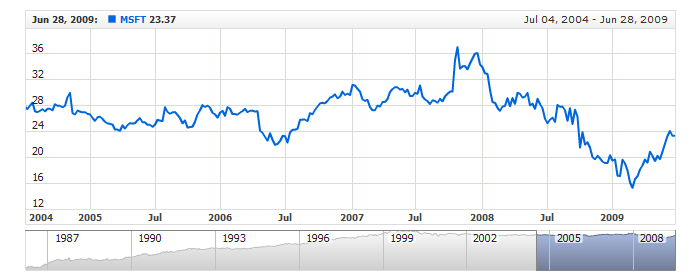
By default Scroller is enabled, but if you want to display charts without zoom and scroll options, or only with scroll bar - you can turn disable scroller. To do so use these XML settings:
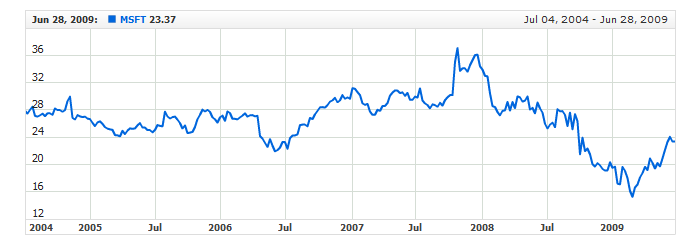
Live sample of the chart without Scroller, note that you still can drag the chart:
![]()
The height of the scroller is fixed in pixels and doesn't change automatically when chart is resized. The default height is 40px, but you can change it if you need.
XML to change the height:
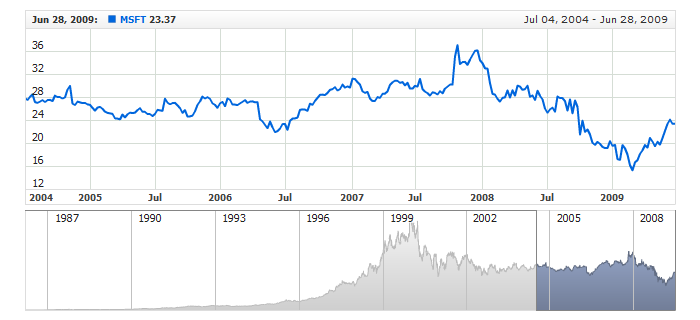
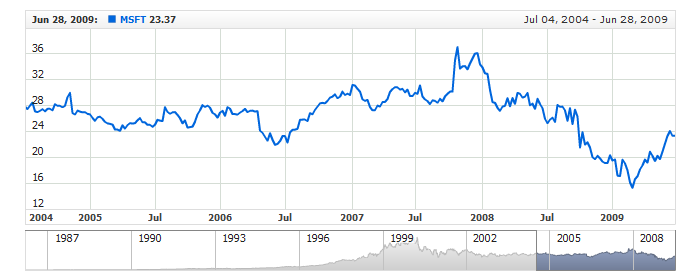
Live sample of the chart with scroller height altered:
![]()
AnyChart Stock has very high performance and you can easily scroll and zoom chart built from very large data sets using scroller. We are talking about zooming and scrolling using these UI elements:
But when data set has more than 100.000 points or data grouping is turned off - these operation may slow down. If you are experiencing such problems you can improve the performance by turning off live chart update.
You can do that for the scroll feature and for the zoom feature separately.
Sample XML to turn of live update of the chart:

As you can see to disable both feature live_scrolling and live_zooming boolean attributes are used.
Live sample of the chart without live chart update - chart will be updated only when user releases the mouse button:
![]()
You can use Logarithmic Scale in scroller just like you use it in charts. By default scroller chart has the linear scale, but you can change this.
XML to enable and tune Scroller Logarithmic Scale:
As you can see you need to use scale_type attribute and set it to "Logarithmic". And you can set logarithm base using log_base attribute.
Live sample of the Scroller with Logarithmic Scale:
![]()
By default, the scroller scale minimum and maximum are calculated automatically; the engine finds the maximum and minimum values in the scroller data set and sets them to the scroller minimum and maximum respectively.
But in some cases - for example, when the chart scale is configured manually - you may also want to set the scale range for the scroller manually. To do so, use the minimum and maximum attributes of the <scroller> node and don't forget to set minimum_mode and maximum_mode attributes to CustomValue.
The illustration below shows how the scroller range limits may affect the appearance of the scroller:
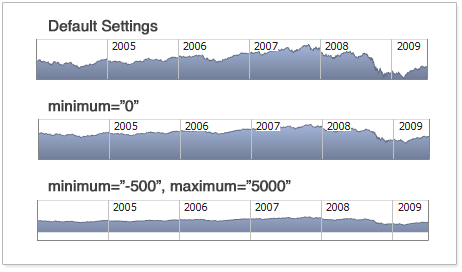
You can set both or only one of the limits. The sample XML below shows how to configure the scroller scale minimum and maximum:
01 |
<settings> |
02 |
<scroller minimum="-500" minimum_mode="CustomValue" maximum="5000" maximum_mode="CustomValue" /> |
03 |
</settings> |
01 | { |
02 | scroller: { |
03 | minimum: -500, |
04 | minimumMode: "CustomValue", |
05 | maximum: 5000, |
06 | maximumMode: "CustomValue" |
07 | } |
08 | } |
Here is a live sample for the settings shown above:
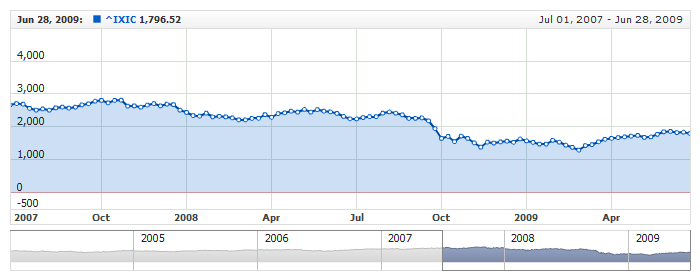
![]()
If you use the inverted scale on one of the charts with data, you may need to use the inverted scale on the scroller as well. To do so, use the inverted attribute in the <scroller> node.
Here is a sample XML with the scroller set to show data in the inverted scale:
Here is a live sample with the inverted scale on the chart and the scroller:
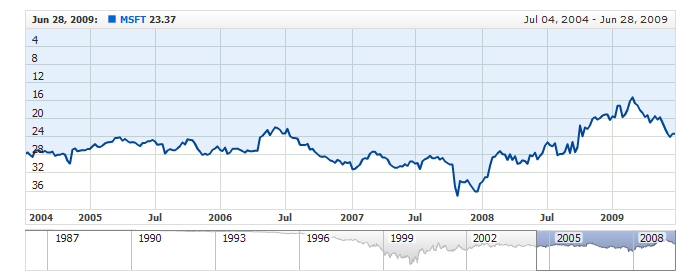
![]()
If the data set used for displaying the scroller chart contains gaps, the component shows those gaps. AnyChart Stock can fill the gaps by joining the boundary points with values. To enable such mode, use the connect_missing_points attribute in the <scroller> node.
The illustration below shows what a scroller that uses a data set with gaps looks like with different settings of the connect_missing_points attribute:
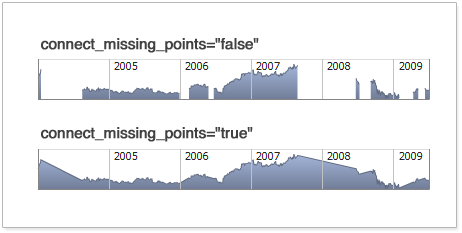
Here is a sample XML for making the engine fill the gaps in the scroller chart:
Here is a live sample for the chart with the settings shown above:
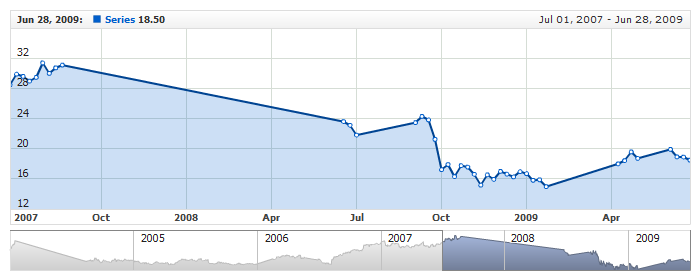
![]()