01 | { |
02 | legend: { |
03 | enabled: false |
04 | } |
05 | } |
This article contains all general legend settings. You will learn how to turn the legend on and off, configure its background and border. This article also contains information about legend margins configuration.
![]()
By default the legend is turned on for each chart, but you can always turn it off, if it isn't necessary.
To turn legend off for the given chart use this XML:
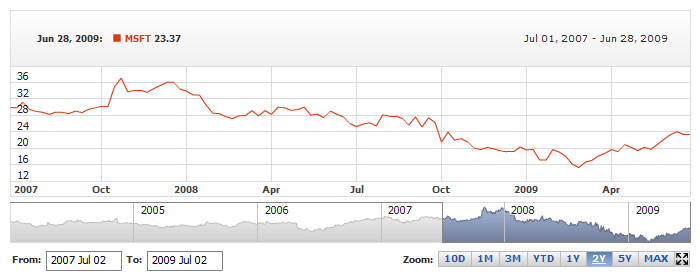
Live sample of the chart without the legend on the main chart:

![]()
Legend background and border is fully configurable, as most of the other chart elements. By default the background has the gradient fill and light gray border - you can set your own colors or turn both of these elements off.
Sample XML for tuning background:

Live sample below shows how settings given above work:

This section shows only a part of XML available to tune background. You can find more in the relevant sections of XML Reference.
![]()
To set margins in legend please use the following XML:
Live sample below shows the legend with modified margins. Note that left and right margins squeeze the content of the legend and legend has less space for elements:
![]()
You can also set padding - the distance between the chart and the legend, illustration below shows what padding are we talking about:
By default the padding is set to zero. XML below shows how to change it:
The size of the padding is set in pixels using padding attribute in <legend> node.
Live sample below shows chart with legend, with padding is set:

![]()