Flex Component: Your First Chart
Overview
This article show step by step how to add AnyStock to Flex project. Before you start this tutorial we recommend to study Flex Component: How it works article.
![]()
Adding component to a project
To start this tutorial we need to obtain flex version of AnyChart Stock, which is shipped in redistributable. If you haven't done this already, please proceed to download page (registred customers: please dowloand yours from Customer Area):
When you have downladed and installed the redistributable, locate an installation folder and you can find AnyChartStock.swc library in swс subfolder.
Then, launch Flash Builder and create an empty flex-project, name it SampleProject, for example, and follow the instructions below:
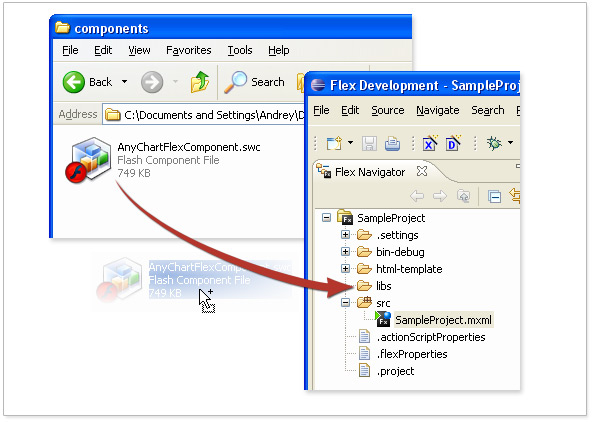
1. Add library to a project
Drag AnyChartStock.swc from swc folder to libs folder of your project, as it shown below:
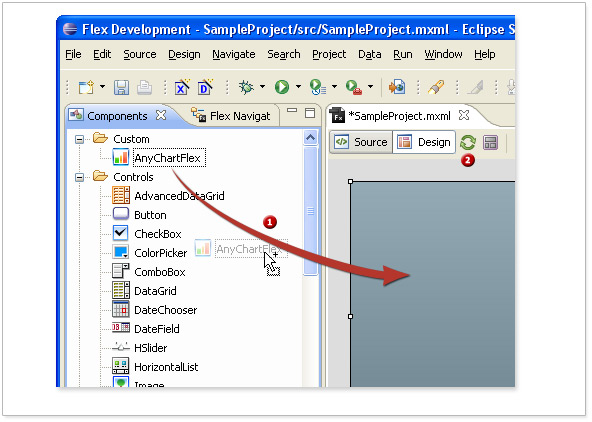
2. Drag and Drop AnyChartStock Component to the stage
After the library added - switch to "Components" and drag AnyChartStock to stage  and hit "Refresh"
 :
:
After the component is added you will see the following in design-time mode:
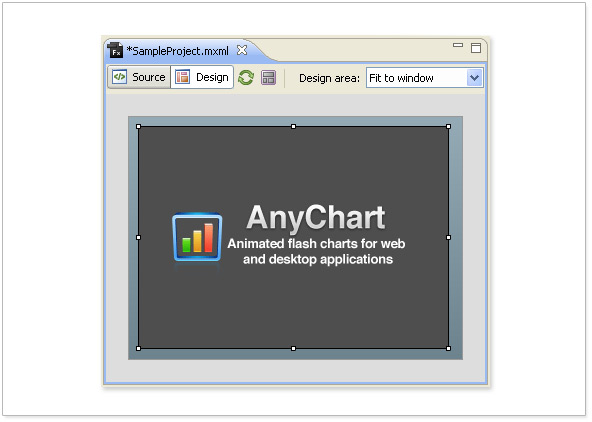
Note: as you can see there is only the logo at design-time, real chart can be seen only at run-time.
![]()
Setting XML config
When you use AnyChart Stock in Flex its setting is done using special XML format, which tells the component how chart should look like and where the required CSV data is.
For our sample we will take the very basic Line chart configuration with CSV table built-in to the XML:
<?xml version="1.0" encoding="utf-8"?>
<stock>
  <data>
    <data_sets>
      <data_set id="dataSetA" source_mode="InternalData">
        <csv_settings ignore_first_row="false" columns_separator="," rows_separator=";" />
          <locale>
            <date_time>
              <format><![CDATA[%yyyy%MM%dd]]></format>
            </date_time>
          </locale>
        <csv_data><![CDATA[20090611,20.1;20090612,19.91;20090615,19.36;20090616,19.08;20090617,19.2;20090618,18.99;20090619,18.92;20090622,18.41;20090623,18.57;20090624,18.61;20090625,19.03;20090626,18.91;20090629,18.99;20090630,18.65;20090701,18.8;20090702,18.5;]]></csv_data>
      </data_set>
    </data_sets>
    <data_providers>
      <general_data_providers>
        <data_provider data_set="dataSetA" id="dpA">
          <fields>
            <field type="Close" column="1" approximation_type="Close"/>
          </fields>
        </data_provider>
      </general_data_providers>
      <scroller_data_providers>
        <data_provider data_set="dataSetA" column="1"/>
      </scroller_data_providers>
    </data_providers>
  </data>
  <settings>
    <charts>
      <chart>
        <series_list>
          <series type="Line" data_provider="dpA" color="#DC3912">
            <name><![CDATA[Series A]]></name>
          </series>
        </series_list>
      </chart>
    </charts>
  </settings>
</stock>
Then we apply this configuration to the chart using config property:
<?xml version="1.0" encoding="utf-8"?>
<mx:Application xmlns:mx="http://www.adobe.com/2006/mxml" layout="absolute"  xmlns:anychartstock="com.anychartstock.*">
   <anychartstock:AnyChartStock x="10" y="10" width="600" height="400">
       <anychartstock:config>
           <mx:XML>
      <stock>
        <data>
          <data_sets>
            <data_set id="dataSetA" source_mode="InternalData">
              <csv_settings ignore_first_row="false" columns_separator="," rows_separator=";" />
              <locale>
                <date_time>
                  <format><![CDATA[%yyyy%MM%dd]]></format>
                </date_time>
              </locale>
              <csv_data><![CDATA[20090611,20.1;20090612,19.91;20090615,19.36;20090616,19.08;20090617,19.2;20090618,18.99;20090619,18.92;20090622,18.41;20090623,18.57;20090624,18.61;20090625,19.03;20090626,18.91;20090629,18.99;20090630,18.65;20090701,18.8;20090702,18.5;]]></csv_data>
            </data_set>
          </data_sets>
          <data_providers>
            <general_data_providers>
              <data_provider data_set="dataSetA" id="dpA">
                <fields>
                  <field type="Close" column="1" approximation_type="Close"/>
                </fields>
              </data_provider>
            </general_data_providers>
            <scroller_data_providers>
              <data_provider data_set="dataSetA" column="1"/>
            </scroller_data_providers>
          </data_providers>
        </data>
        <settings>
          <charts>
            <chart>
              <series_list>
                <series type="Line" data_provider="dpA" color="#DC3912">
                  <name><![CDATA[Series A]]></name>
                </series>
              </series_list>
            </chart>
          </charts>
        </settings>
      </stock>
           </mx:XML>
      </anychartstock:config>
        </anychartstock:AnyChartStock>
</mx:Application>
Download Sample Source Code
You can view and download this sample at:
You can find an advanced sample at: Flex Component: Stock Portal
![]()