AnyChart presents the first version of long-awaited AnyChart Map Converter utility.This program is designed to convert ESRI ShapeFiles (*.shp) into the special AMAP format for using in the geo map module of AnyChart Flash Component - AnyMap.
Now AnyChart users are not limited with default set of maps delivered with AnyChart component distribution package. The flexible and intuitively clear interface of AnyChart Map Converter utility provides a wide range of functions to obtain the required result:
AnyChart Map Converter features:This utility is distributed for free.
Please Download AnyChart Map Converter
Note that this product is designed for Windows platforms and requires .NET Framework 3.5 installed.
In this tutorial you can learn how to use AnyChart Map Converter and how to create your own Flash Maps for web.
Converter is shipped in GUI version and Command Line version, the first gives you the ability to see all changed you are doing to the source map visually, the last is intended to convert prepared map according to some preset parameters.
We recommend you to to study How to create Simple Map tutorial, before reading this document, in which AnyChart Flash Map architecture is be explained.
Main ideas of AnyChart Flash maps are:
AnyChart.swf is an almighty engine that is able to create a number of chart types with different orientations and visualization options, and "Map" is a special plot_type that allows you to display Flash maps on your web-pages almost the same way as charts are created.
The only difference between charts and maps is the fact, that map itself (the shapes of regions, their names, geographical coordinates, etc.) is stored in a separate file with "amap" extension. (Read more about "amap" files below).
You can place an swf file, amap file, xml file (or server-side script that creates XML file) to your server and with a small piece of JavaScript code add interactive Flash Maps to your web-site or web-application.
![]()
".amap" files are maps encoded in a proprietary AnyChart format created to store geographical data. Each ".amap" file contains a single map, for example: Map of the USA divided into Single states, or Map of USA divided into single Counties.
Each file contain information about geographical coordinates and shapes of regions, along with some additional data (for example FIPS codes of states). You don't have to know actual format of these files - AnyChart parses all information automatically - all you have to do is to create XML settings file, that tells AnyChart engine to load certain map and define how it should be displayed.
There are a lot of ".amap" files shipped with AnyChart package at no additional cost, full list of them can be found in Available Maps List.
This document describes how to create your own AMAP files using AnyChart Map Converter.
![]()
The ESRI Shapefile or simply a shapefile is a popular geospatial vector data format for geographic information systems software. It is developed and regulated by ESRI as a (mostly) open specification for data interoperability among ESRI and other software products. A "shapefile" commonly refers to a collection of files with ".shp", ".shx", ".dbf", and other extensions on a common prefix name (e.g., "lakes.*"). The actual shapefile relates specifically to files with the ".shp" extension, however this file alone is incomplete for distribution, as the other supporting files are required.
Shapefiles spatially describe geometries: points, polylines, and polygons. These, for example, could represent water wells, rivers, and lakes, respectively. Each item may also have attributes, that describe the items, such as the name or temperature.
There are a number of places where you can find free and commercial SHP maps, if you'd like to edit the maps obtained or create your own you should obtain some 3rd party SHP editor like:
NOTE: AnyChart doesn't support these products and has no liaison to tools mentioned above, the links and names are provided as the helpful information only.
Here is a sample list of 3rd party sites that provide SHP based geo maps:
USA, Canada, Caribbean; Central and South Americas
European Region
Asia, Australia and Oceania
Africa
Miscellaneous
NOTE: AnyChart has no liaison to sites mentioned above and doesn't guarantee the compatibility of files obtained from that sites and AnyChart Map Converter.
![]()
".amap" files are maps encoded in a proprietary AnyChart AMAP format created to store geographical data. Each ".amap" file contains a single map, for example: Map of the USA or Map of the World.
Why AnyChart uses AMAP and not ESRI directly? There are three main points:
Why do these points are important?
Important Note
AnyChart AMAP Maps are not intended for use in applications that require precise geo-positioning, they are intended for demonstration, statistical and educational purposes only.
Although we give users an ability to place points according to their latitude and longitude - we do not guarantee any accuracy that can be crucial for certain kinds of applications.
Maps shipped in package and generated are simplified - which means that some points from polygons (region borders for example) are removed, so you can not rely on them as on the source of inevitable information about countries or region borders.
![]()
When you are trying to convert SHP map with AnyChart Map Converter please keep in mind that:
If you have the maps that conforms to this requirements, but still can't be processed with AnyChart Map Converter - please contact us and we will try to help.
GUI version gives you the ability to see all changes you are doing to the source map visually and change label placement position, almog with ability to generate sample map.
![]()
AnyChart Map Converter is designed for Windows and requires .Net Framwork 3.5 to be installed on your PC.
You can download and install .Net Framework 3.5 from Microsoft website.
After having framework installed please Download AnyChart Map Converter and install it to your PC.
First thing you should when converter is launched is loading shp map you want to convert, please note that all shx, dbf, shp, etc. files should be placed to the same folder where shp file is located.
To load shp file - click "File"->"Load ShapeFile...".
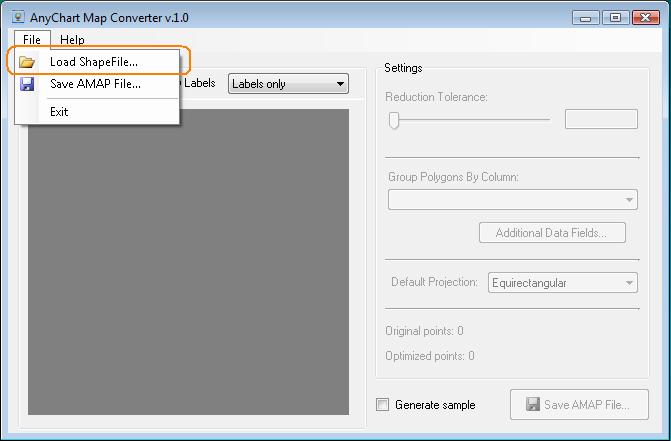
After choosing shp file a progress bar will be shown, it may take some time - depending on the size of the map.
If any error occured during load please make sure you have 3.5 version of .Net Framework and note this input map requirements.
![]()
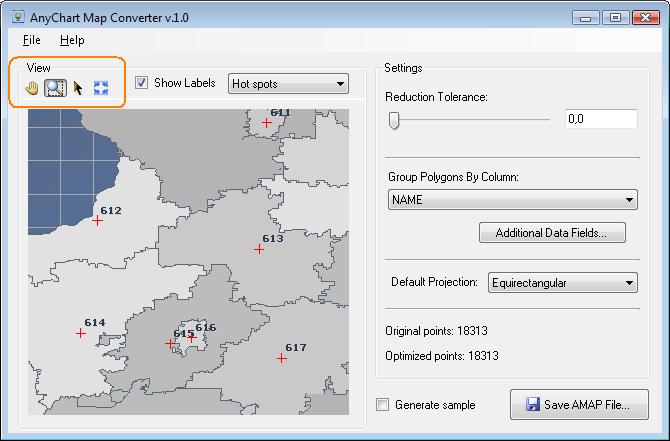
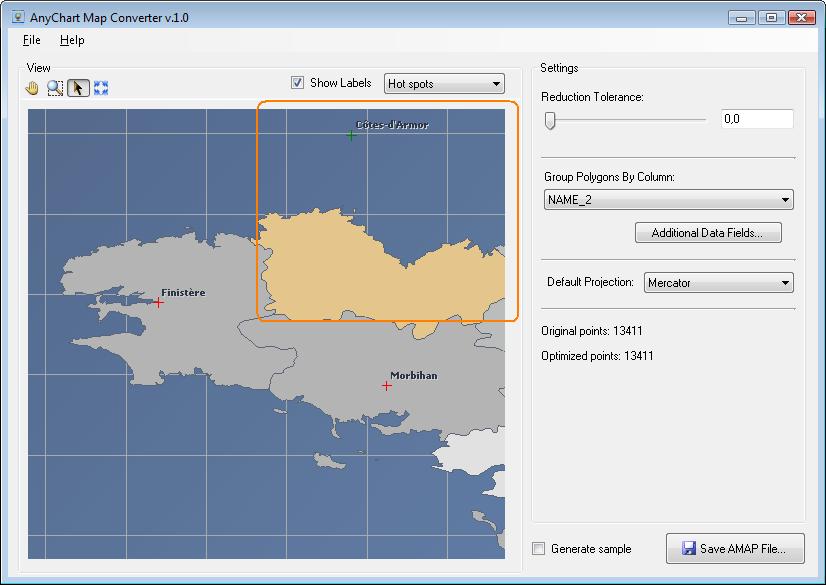
As soon as the map is loaded you can use navigation tools located in the top left corner of map preview to drag, zoom-in or fit the map.
![]()
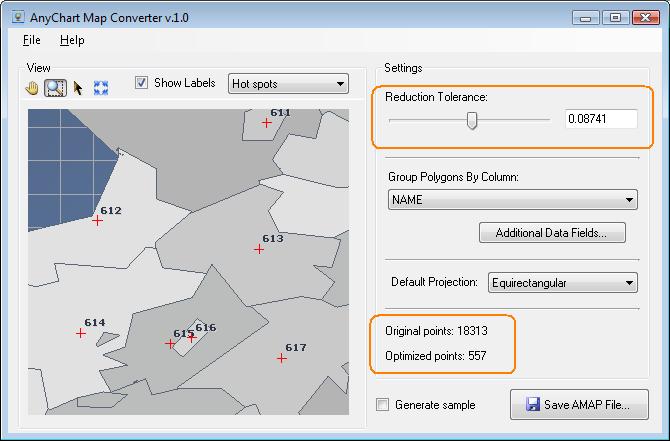
To make map load faster when working with it in Flash and decrease loading time - you can simpify the map using converters "Reduction tolerance" parameter.
Tolerance is measured from zero (no points removed) to 1 (the maximum number of points is removed).
Drag the slider and look at the map preview to decide what value is acceptable, but keep in mind that the lower value you choose - the bigger output map you will get, and it work slower than the same map with higher tolerance set.
Right above the "Save AMAP File" button you can see the number of the points in the original map and the number of points that converter will include into amap file.
![]()
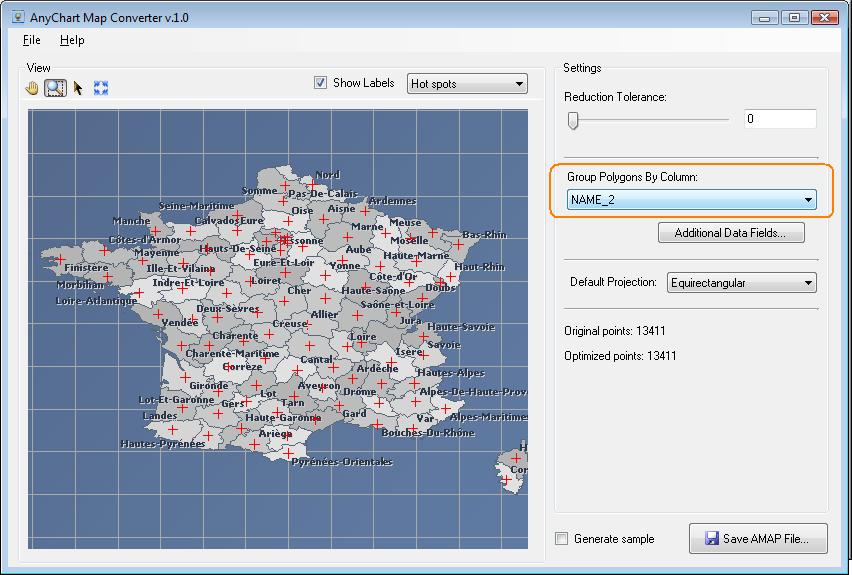
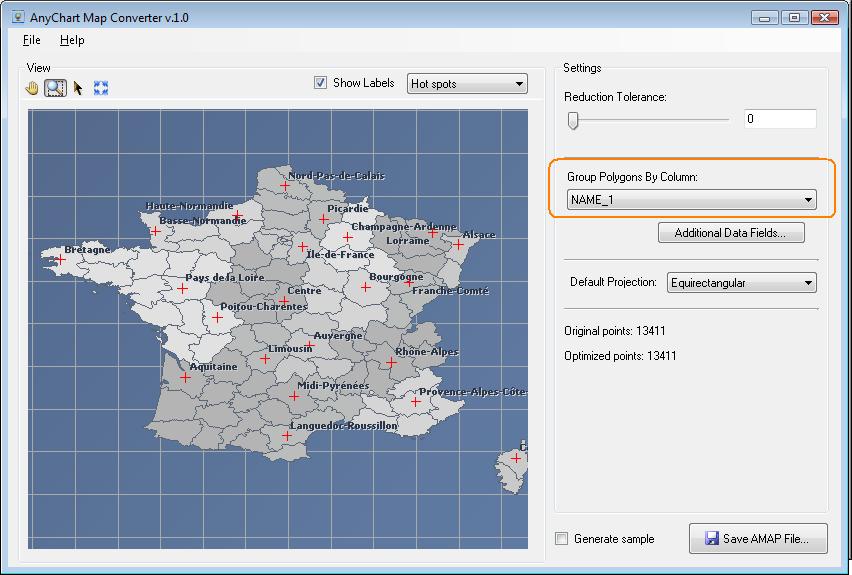
When you work with Map Series Points in AnyChart - you always operate with some region defined by its unique index in AMAP data table. When you are converting shp to AMAP you can choose a column that is use to group regions. Please take a look at the part of data table of the administrative map of France:
| NAME_0 | NAME_1 | NAME_2 |
| France | RhЇne-Alpes | Ain |
| France | Picardie | Aisne |
| France | Auvergne | Allier |
| France | Poitou-Charentes | Charente |
| France | Poitou-Charentes | Charente-Maritime |
There is one unique name in NAME_0 column, four in NAME_1, and five - in NAME_2.
Depending on the column - there will be the different number of regions in the AMAP and they will be grouped according to the column of your choice.
Below you can see how map looks like with different columns choosen for grouping.
![]()
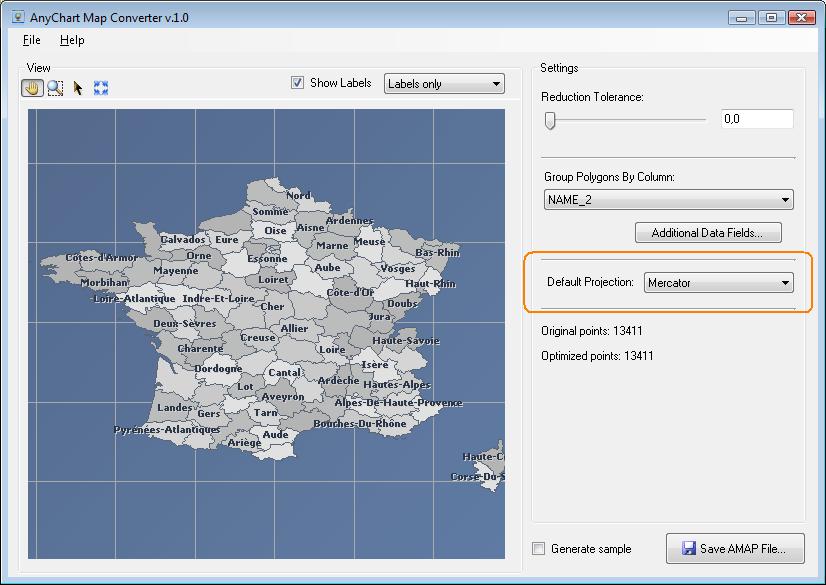
AnyChart Map engine supports several projections that can be switched in XML, in converter - you can choose the default one.
Please read more about projections in AnyChart Documentation: Projections Tutorial.
Please note - changing projection in AnyChart Map Converter doesn't change projection in preview - the result can only be seen in real map rendered from amap with AnuChart Engine.
![]()
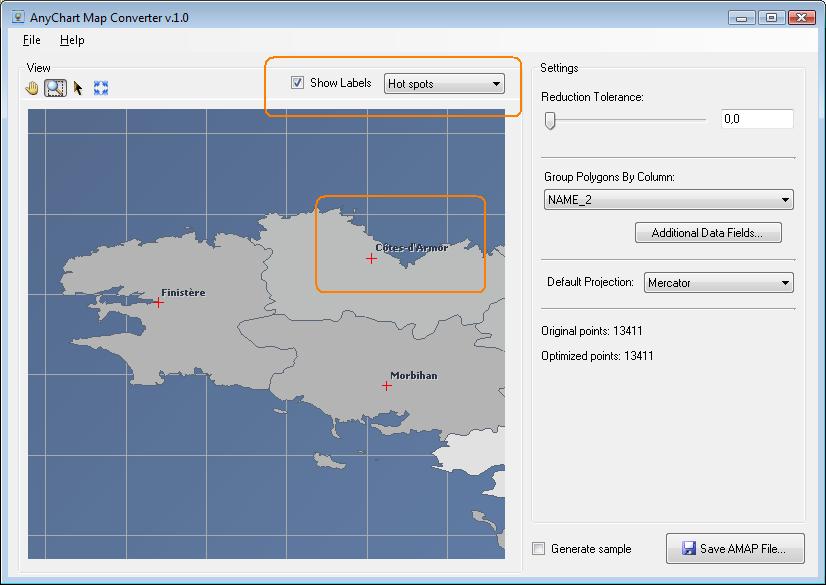
When you load map into the converter you can see red crosses all over the map - they mark the point of label placement in AnyChart Map engine.
The labels in preview window are not real AnyChart labels - they are here just to help you distinguish regions.
You can change the label placement before you generate the amap file to get the desired label placement.
Here is a sample sequence of actions to change label position:
1) Locate the region with a label you want to move and zoom (for example) to it, please note that you can either see labels only or labels with label hotspot:
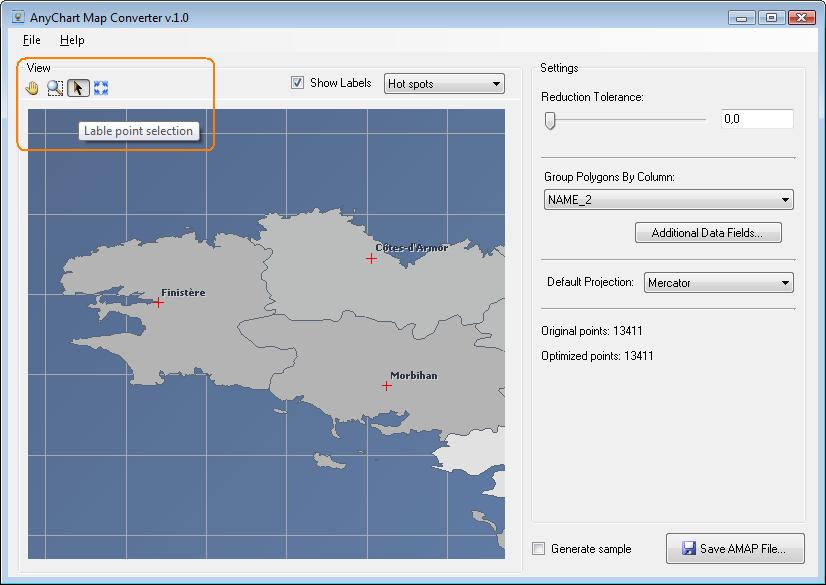
2) Choose "Pointer Cursor" tool on the navigation toolbar:
3) Click the red cross of the label you want to move - it should turn green and labeled region is highlighted:

4) Click and Drag the cross with the label to the new place:
5) Zoom out - you can see that the label changed its position:

When you are done with moving labels - you can generate AMAP file.
![]()
By default AnyChart Map Converter adds only grouping column into the AMAP file, but your shp map may contain a lot of fields which you may need in the map. You can add these fields into AMAP file. To do that - click "Additional Data Fields" under grouping column combo box:
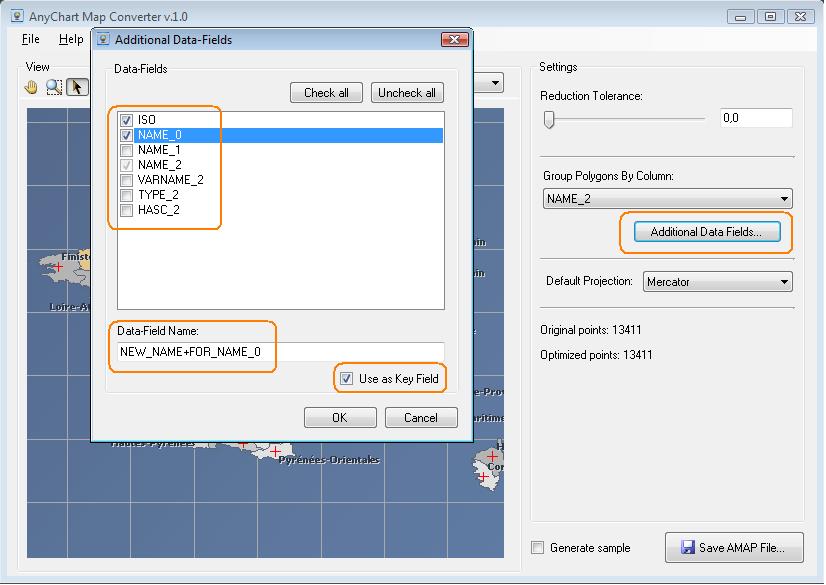
You can choose what fields should be added, set the name of the field in the AMAP file and set whether it can be the index field (undefault grouping column defined in XML).
![]()
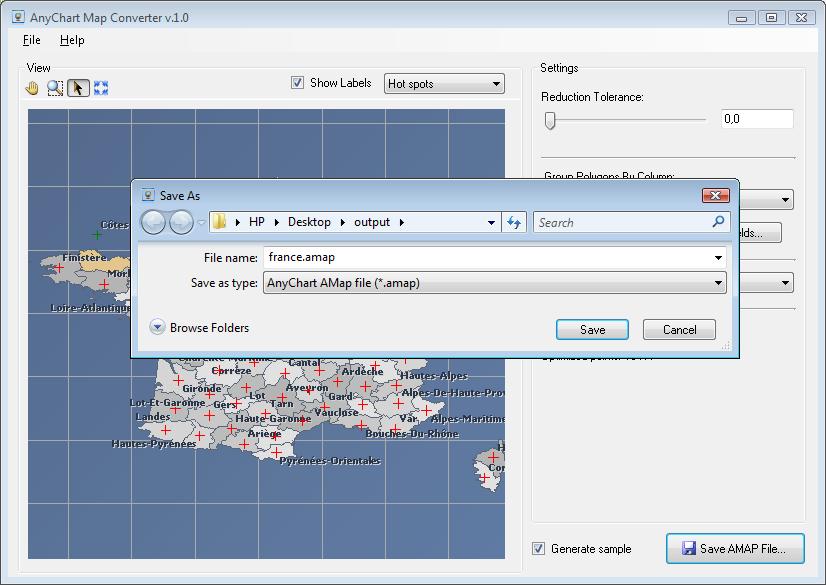
When you have choosen default projection, tolerance, grouping, tuned labels position, choosen additional data fields you can generate AMAP file to use in your project, to do that just click "Save AMAP File..." button:
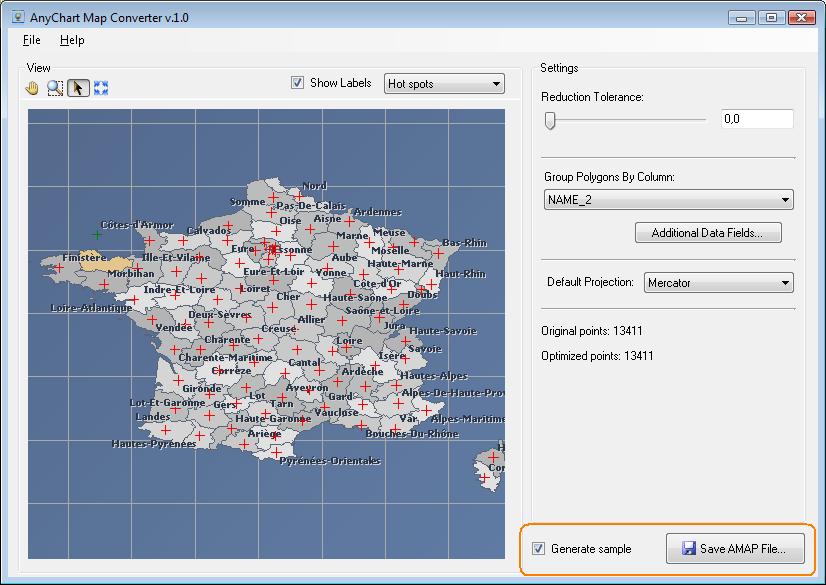
When you are ready to generate - check "Generate sample" checkbox if you'd like to get HTML+JS+XML+AMAP+SWF sample of ready to go map rendered using AnyChart from AMAP generated. The sample will be placed to the same folder where you will save AMAP file, in the folder with the same name:


You may need to run register.bat to run this sample on your local PC.
You should load all files including AMAP file to your web-server to get the sample running on your web-server.
![]()
Command Line version is intended to convert prepared map according to some preset parameters, it may be useful when you need to convert large quantity of maps in a silent mode. You can do almost everything you can do with GUI version.
![]()
AnyChart Map Converter Command Line (Batch) version is designed for Windows and requires .Net Framwork 3.5 to be installed on your PC.
You can download and install .Net Framework 3.5 from Microsoft website.
After having framework installed please Download AnyChart Map Converter and install it to your PC.
Command line version is located in the folder where AnyChart Map Converter is installed and named shp2amap.exe
Below you will find a list of parameters this version accepts and launching samples.
![]()
shp - Input shp file name. (Aliases: input, i)
amap - Output amap file name. (Aliases: output, out, o)
Example:
shp2amap.exe shp=usa.shp; amap="c:\amap files\usa.amap";
shp2amap.exe shp="c:\shp files\usa.shp"; amap="c:\amap files\usa.amap";
tolerance - Points reduction tolerance. (Aliase: t)
Example:
shp2amap.exe shp=usa.shp; amap=usa.amap; tolerance=0.01;
groupcolumn - Grouping column. (Aliases: g)
Example:
shp2amap.exe shp=usa.shp; amap="usa.amap"; groupcolumn=0;
shp2amap.exe shp=usa.shp; amap="usa.amap"; groupcolumn="2";
includealldata - Include all data from shp data table into amap (if set - columns parameter is ignored). (Aliases: iad)
Example:
shp2amap.exe i=usa.shp; o="usa.amap"; g=2; includealldata;
columns - Specifies columns to include into amap. Grouping column is included by default.
Columns are enumerated separated by commas, string in square brackets stands for the name of column in amap file.
Plus sign after the number means that column can be the index.
Examples:
shp2amap.exe i=usa.shp; o="usa.amap"; g=2; columns="0[New name],1,2[key 2 column]+,4+";
shp2amap.exe i="D:\SHPMaps\t1.shp"; o=a.amap ; t=0,01 ; g=2 ; columns="0[Null],1+,2[ID],4[ADD_INFO]";
![]()
Very often SHP files are stored and used in projected form and changed coordinate system, in such cases AnyChart Map Converter may crash during reading or converting. There also may be the cases when reprojected map is read and converted, but the resulting amap would not show nothing but a white space in AnyChart.
We would not provide any detailed explanation what projections are and what alll their parameters mean, but we will provide the explanation how you can easily reproject your shp file in order to process it with AnyChar Flash Map Converter.
Let's start it step-by-step:
MapWindow application is a free, extensible, geographic information system developed by Idaho State University Software Lab.
You need to download the installation of MapWindow to your PC first. We have tested Full MapWindow GIS application installation - stable release version 4.6 available from:
If the link above doesn't work, please goto MapWindow website: http://www.mapwindow.org/ and locate the Download Section to obtain 4.6 version (or older, but something may change in future versions).
Note that AnyChart doesn't provide any support to MapWindow and is not affiliated with it anyhow.
After downloading the installation file - please install MapWindow GIS to your PC, installation is rather straightforward - do not alter any settings it offers you by default and you'll get it installed soon.
After the installation please run MapWindow GIS:
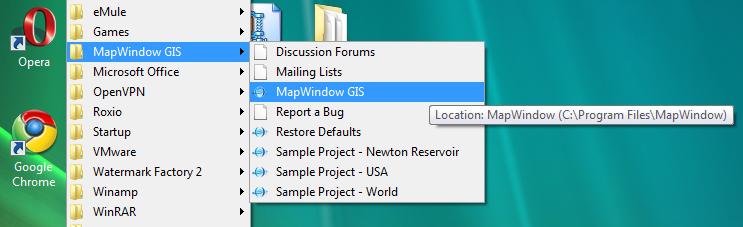
You will see screen like this:
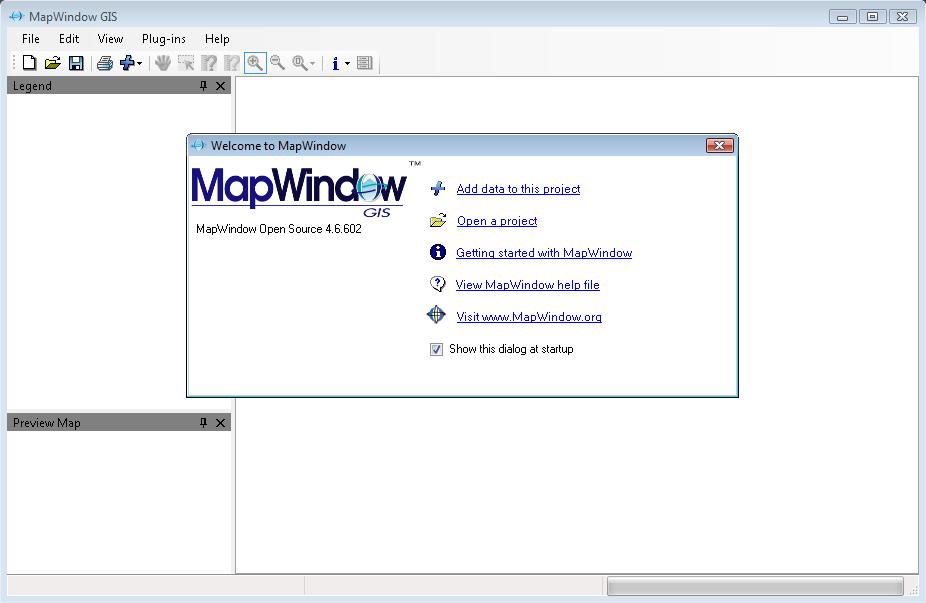
Close nag-screen and enable GIS Tools Plug-in:
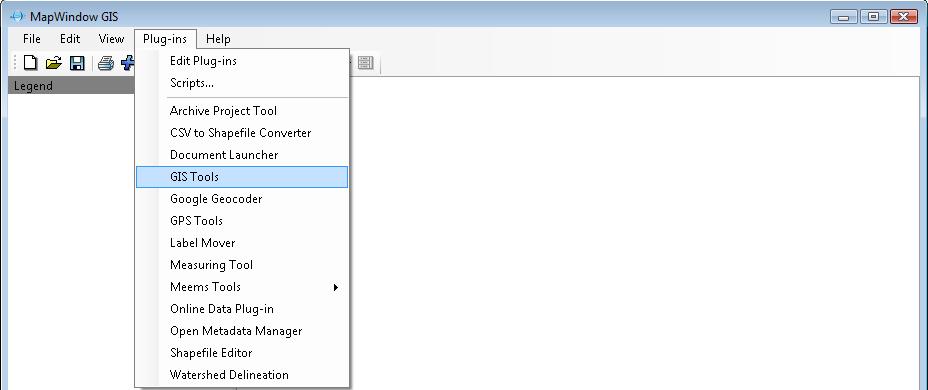
It should appear in menu toolbar now:
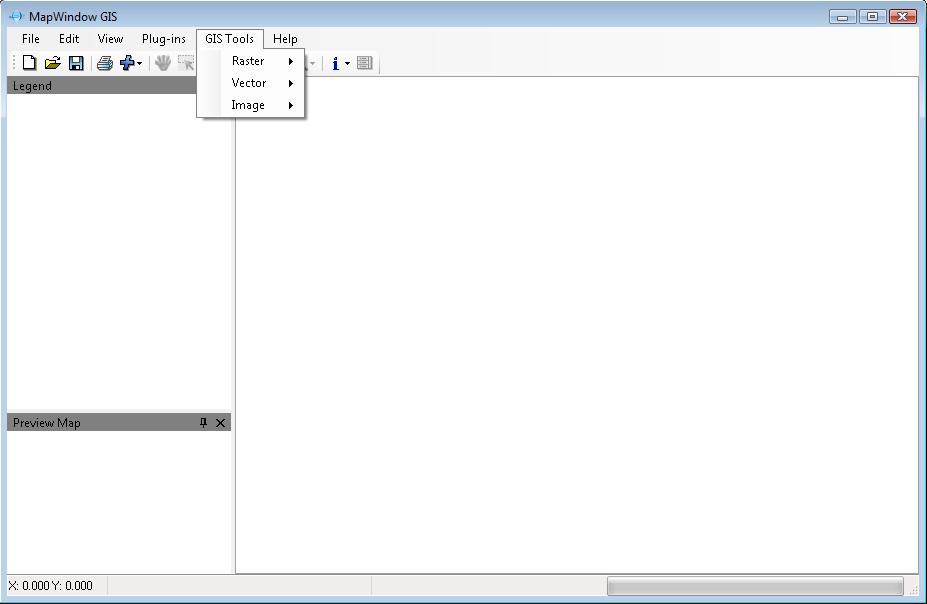
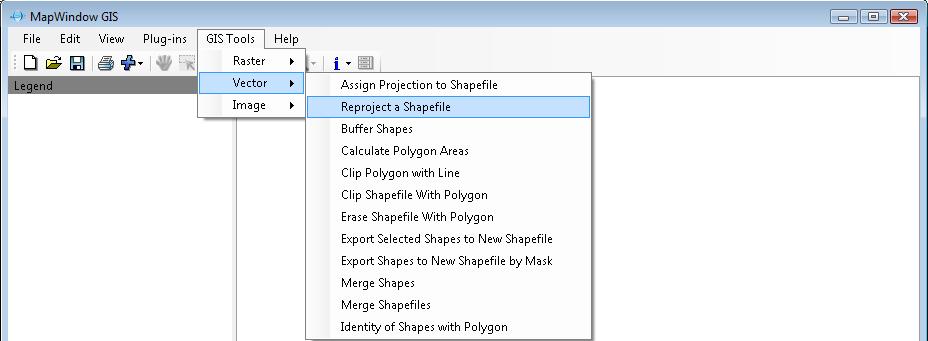
Choose GIS Tools -> Vector -> Reproject a Shapefile:
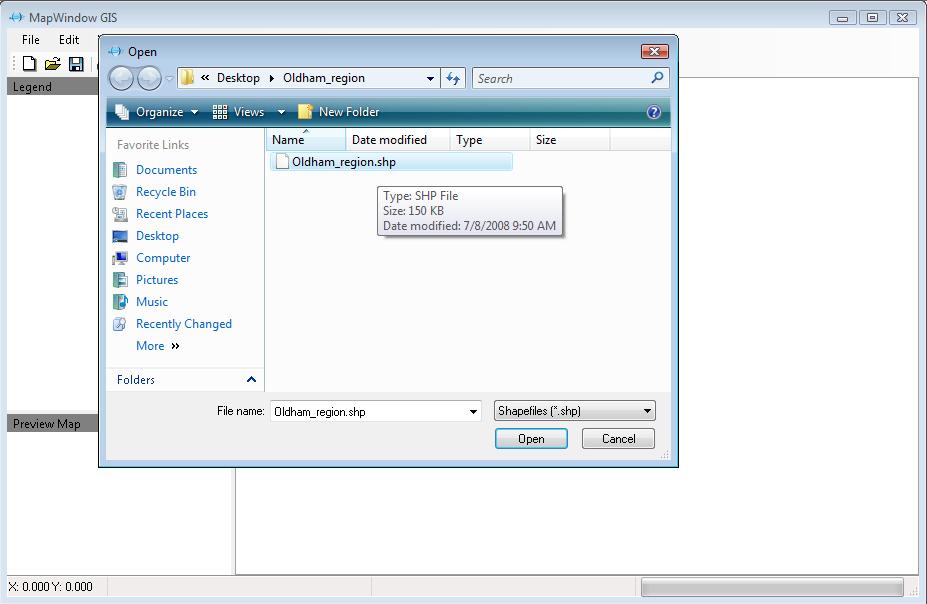
Choose a Shapefile you want to reproject:
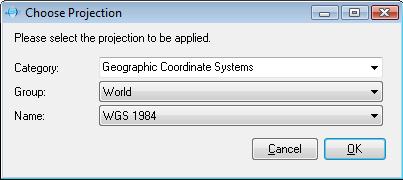
You will be prompted to choose a new projection for your Shapefile, please choose:
Category: Geographic Coordinate Systems
Group: World
Name: WGS 1984
and click OK.
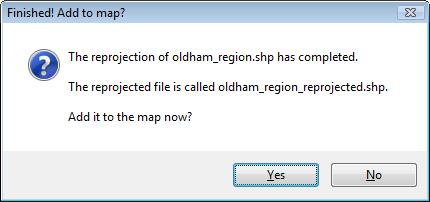
The new file will be created and placed to the same folder where your original file is located, you don't need to add reprojected file to the map, so click "No":
Now you can open the folder where original Shapefile is located and find there the reprojected one:
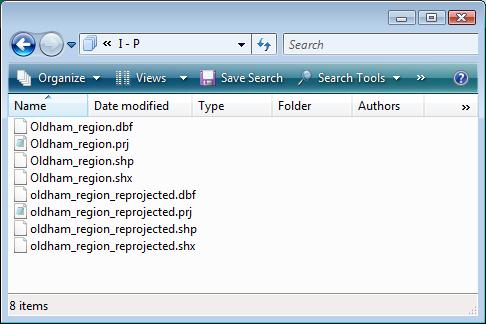
For now - just load reprojected file, instead of original one, into AnyChart Flash Map Converter and create amap from it.
![]()