Map Projection
Overview
A map projection is any method used in cartography to represent the two-dimensional curved surface of the earth or other body on a plane. The term "projection" here refers to any function defined on the earth's surface and with values on the plane, and not necessarily a geometric projection.
Flat maps could not exist without map projections, because a sphere cannot be laid flat over a plane without distortions.
Map projections can be constructed to preserve one or some of map regions properties (area, shape, direction, bearing, distance, scale), though not all of them simultaneously. Each projection preserves or compromises or approximates basic metric properties in different ways. The purpose of the map, then, determines which projection should form the base for the map. Since many purposes exist for maps, so do many projections exist upon which to construct them.
AnyChart allows to display any map in 10 projections, below you will find a list of all available projections with map samples.
Depending on your visualization task you can choose what projection to use in your project or give end-user an ability to swap projections in real-time.
![]()
Setting map projection
To set map projection you should set its type in <projection> sub node of <map_series> node:

01 |
<map_series source="europe/united_kingdom.amap"> |
02 |
<projection type="Robinson" /> |
03 |
</map_series> |
![]()
Available projections
The table below lists all available projection types, samples can be found after the table.
| type | Description |
|---|---|
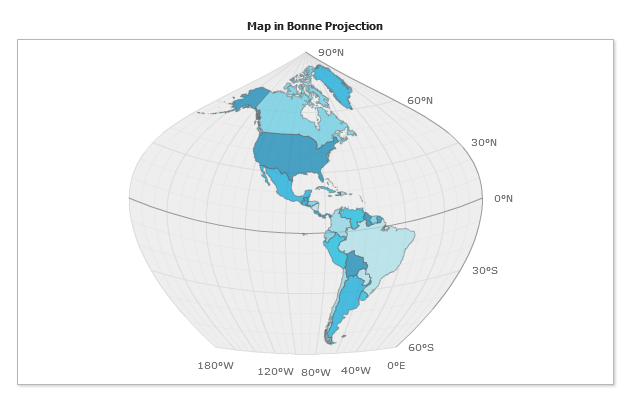
| Bonne | A Bonne projection is a pseudoconical equal-area map projection, sometimes called a dépôt de la guerre or a Sylvanus projection. It is named after Rigobert Bonne (1727-1795), who used this projection considerably. |
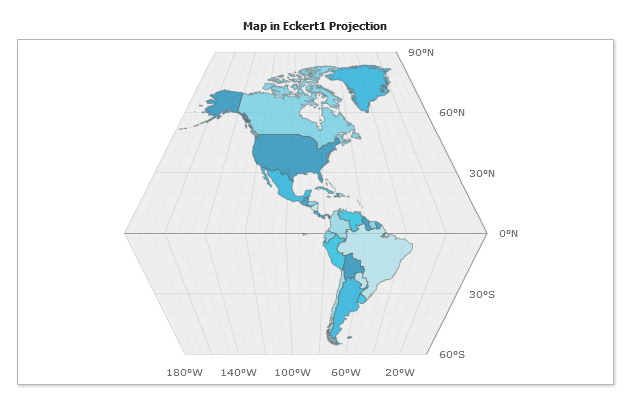
| Eckert1 | Pseudocylindrical, neither conformal or equal-area, devoloped by Max Eckert (-Greifendorff); in 1906. |
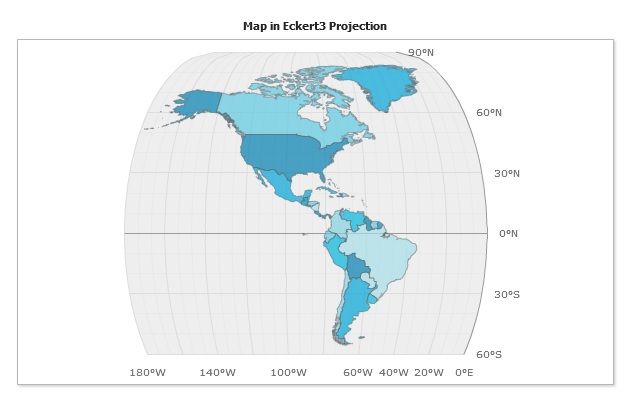
| Eckert3 | Pseudocylindrical, neither conformal or equal-area, developed by Max Eckert (-Greifendorff) in 1906. |
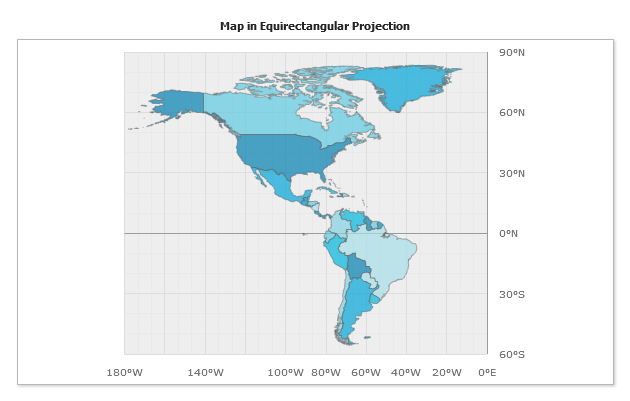
| Equirectangular | The equirectangular projection (also called the equidistant cylindrical projection, geographic projection, or carte parallelogrammatique projection or CPP) is a very simple map projection attributed to Marinus of Tyre, who Ptolemy claims invented the projection about 100 AD. The projection maps meridians to equally spaced vertical straight lines, and parallels to equally spaced horizontal straight lines. |
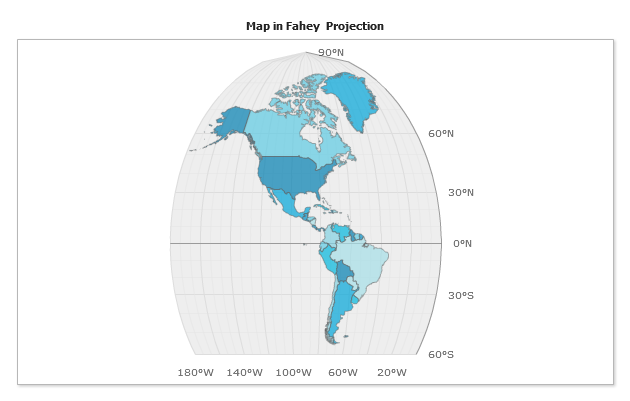
| Fahey | Fahey Modified Gall, pseudocylindrical, neither conformal or equal-area, developed by Lawrence Fahey in 1975. |
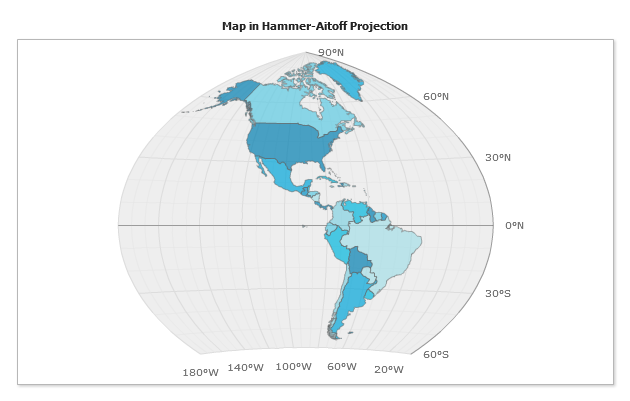
| Hammer-Aitoff | Hammer-Aitoff projection produces an equal area map of the entire globe, it is useful for visual representations of geographically related statistical data and distributions. Astronomers use this projection to show the entire celestial sphere on one map in a way that accurately depicts the relative distribution of the stars in different regions of the sky. |
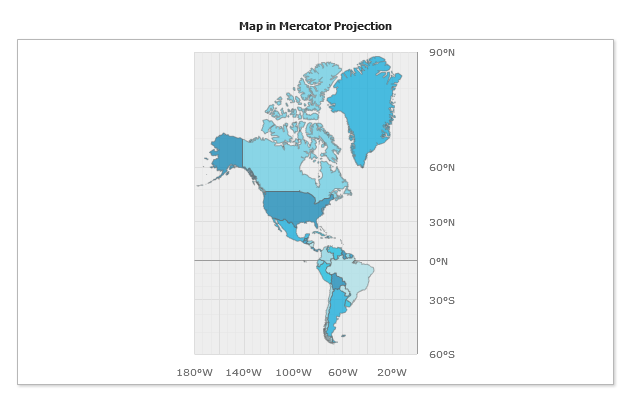
| Mercator | The Mercator projection is a cylindrical map projection presented by the Flemish geographer and cartographer Gerardus Mercator, in 1569. It became the standard map projection for nautical purposes because of its ability to represent lines of constant true bearing or true course, known as rhumb lines, as straight line segments. While the direction and shapes are accurate on a Mercator projection, it distorts the size. |
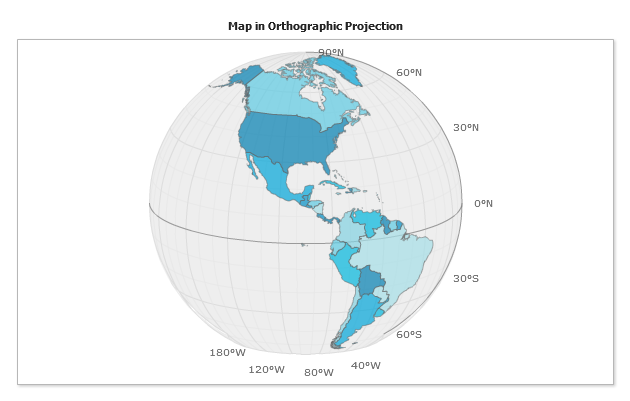
| Orthographic | Orthographic projection is a map projection of cartography. Like the Stereographic projection and Gnomonic projection, Orthographic projection is a perspective (or azimuthal) projection, in which the sphere is projected onto a tangent plane or secant plane. The point of perspective for the Orthographic projection is at infinite distance. It depicts a hemisphere of the globe as it appears from outer space. The shapes and areas are distorted, particularly near the edges, but distances are preserved along parallels. |
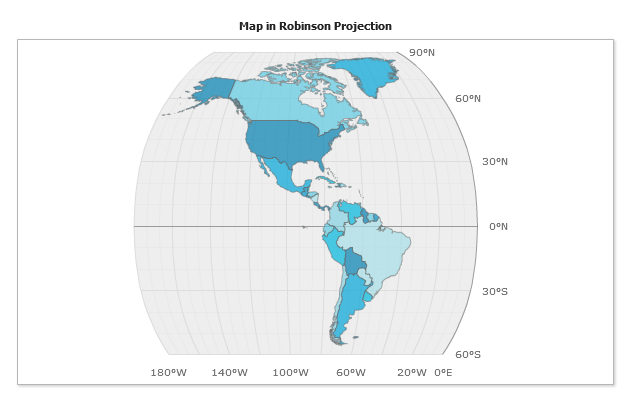
| Robinson | A pseudo-cylindrical projection by reason of its straight parallels, along each of which the meridians are spaced evenly. The central meridian is also a straight line; other meridians are curved. Developed by Dr. Arthur H. Robinson in 1963. |
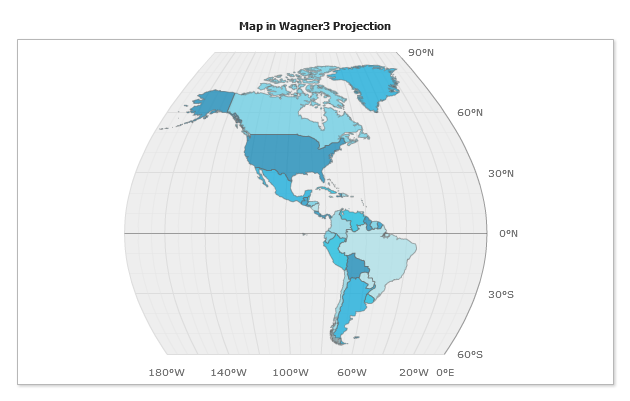
| Wagner3 | A pseudocylindrical projection, neither conformal or equal-area, developed by K. H. Wagner in 1932. |
![]()
Bonne projection
Map of USA in Bonne projection
![]()
Eckert1 projection
Map of USA in Eckert1 projection
![]()
Eckert3 projection
Map of USA in Eckert3 projection
![]()
Equirectangular projection
Map of USA in Equirectangular projection
![]()
Fahey projection
Map of USA in Fahey projection
![]()
Hammer-Aitoff projection
Map of USA in Hammer-Aitoff projection
![]()
Mercator projection
Map of USA in Mercator projection
![]()
Orthographic projection
Map of USA in Orthographic projection
![]()
Robinson projection
Map of USA in Robinson projection
![]()
Wagner3 projection
Map of USA in Wagner3 projection
![]()