Gauge Templates Tutorial
Overview
To simplify the creation of gauges AnyGauge provides "Gauge Templates" technique. Gauge template is a named preset for any of the gauge settings (except certain pointers settings). Templates can be stored within gauge XML and in an external file.
In this tutorial we will explain what templates can be used for and how they can be used.

Templates Explained
The main idea of templates is to segregate gauge settings and data section for easy changing and/or reuse in other gauges that should look the same way.
For example you can create a template that defines that gauge should be of circular type, has a certain pointer, certain axes labels and tooltips. This type of gauge will be widely used on your site, so you just store it in some xml file and when you need such chart you just specify what template should be used - you don't need to configure gauge again an copy-paste settings from one place to another.
Another example of templates use - you can create several templates that configure different gauge look (colors, border, etc.), store them in a single place and then you can choose how gauge should look like (depending on users choice, for example).
How to create template
In AnyGauge there are two ways to create a template. First is to define a template for all your gauges and place it in templates->template. But there is also a second way. Each "general" template houses 4 sub-templates, their syntax is as follow:
04 |
<circular_template name="" parent="" /> |
05 |
<linear_template name="" parent="" /> |
So, there is a separate template for sircular gauges and linear gauges. What's the use of it? Well, for example you have a template with predefined settings for circular gauges and linear gauges. And now you want to create a combination of circular and libear gauge and take some settings from your template, but settings only for circular gauges, as you want to fully change the view of linear gauge itself. That's when you need templates for each type of the gauge.
For example, you've took a sample Circular template from Circular Gauge Tutorial, its XML look like that:
01 |
<?xml version="1.0" encoding="UTF-8"?> |
06 |
<title enabled="false" /> |
09 |
<axis start_angle="90" radius="75" sweep_angle="180"> |
10 |
<scale minimum="0" maximum="100" major_interval="10" /> |
11 |
<labels enabled="true" rotate_circular="false" align="Inside" padding="10"> |
12 |
<format><![CDATA[{%Value}{numDecimals:0}]]></format> |
14 |
<major_tickmark enabled="true" shape="Rectangle" width="1.5" height="8" align="Center" padding="0"> |
15 |
<fill enabled="true" color="#494949" opacity="0.8" /> |
17 |
<minor_tickmark enabled="true" shape="Rectangle" width="1.5" height="4" align="Center" padding="0"> |
18 |
<fill enabled="true" color="#494949" opacity="0.8" /> |
20 |
<scale_bar enabled="true" shape="Bar" align="Center" padding="0" width="8"> |
21 |
<fill enabled="true" type="Solid" color="#E0E0E0" /> |
22 |
<border enabled="true" type="Solid" color="#D3D2CC" /> |
26 |
<pointer type="Needle" value="70" /> |
Suppose you will create such gauges many times, and all of them will have the same axes settings,
labels format and major/minor tickmarks settings, so you want to move to the template these settings.
So, the template should look like that (we will name it "Sample Template"):
01 |
<template name="Sample Template"> |
03 |
<circular_template name="Cir_1"> |
04 |
<axis start_angle="90" sweep_angle="180"> |
05 |
<scale minimum="0" maximum="100" major_interval="10" /> |
06 |
<labels enabled="true" rotate_circular="false" align="Inside" padding="10"> |
07 |
<format><![CDATA[{%Value}{numDecimals:0}]]></format> |
09 |
<major_tickmark enabled="true" shape="Rectangle" width="1.5" height="8" align="Center" padding="0"> |
10 |
<fill enabled="true" color="#494949" opacity="0.8" /> |
12 |
<minor_tickmark enabled="true" shape="Rectangle" width="1.5" height="4" align="Center" padding="0"> |
13 |
<fill enabled="true" color="#494949" opacity="0.8" /> |
15 |
<scale_bar enabled="true" shape="Bar" align="Center" padding="0" width="8"> |
16 |
<fill enabled="true" type="Solid" color="#E0E0E0" /> |
17 |
<border enabled="true" type="Solid" color="#D3D2CC" /> |
Now, when template is ready we will learn where we can store them and how to apply them.
Internal Templates
You can store you templates within chart XML, in <templates> subnode of <anychart> node:
01 |
<?xml version="1.0" encoding="UTF-8"?> |
04 |
<template name="Sample Template"> |
06 |
<circular_template name="Cir_1"> |
07 |
<axis start_angle="90" sweep_angle="180"> |
08 |
<scale minimum="0" maximum="100" major_interval="10" /> |
09 |
<labels enabled="true" rotate_circular="false" align="Inside" padding="10"> |
10 |
<format><![CDATA[{%Value}{numDecimals:0}]]></format> |
12 |
<major_tickmark enabled="true" shape="Rectangle" width="1.5" height="8" align="Center" padding="0"> |
13 |
<fill enabled="true" color="#494949" opacity="0.8" /> |
15 |
<minor_tickmark enabled="true" shape="Rectangle" width="1.5" height="4" align="Center" padding="0"> |
16 |
<fill enabled="true" color="#494949" opacity="0.8" /> |
18 |
<scale_bar enabled="true" shape="Bar" align="Center" padding="0" width="8"> |
19 |
<fill enabled="true" type="Solid" color="#E0E0E0" /> |
20 |
<border enabled="true" type="Solid" color="#D3D2CC" /> |
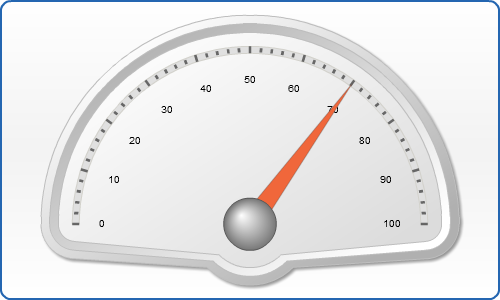
Sample gauge using internal template, click to view live sample and XML settings:
Live Sample: Sample Templates Gauge 1
External Templates
Next, you can create a file with templates and attach it to the certain chart XML's.
In templates files root node will be <templates>:
02 |
<template name="No Title #1"> |
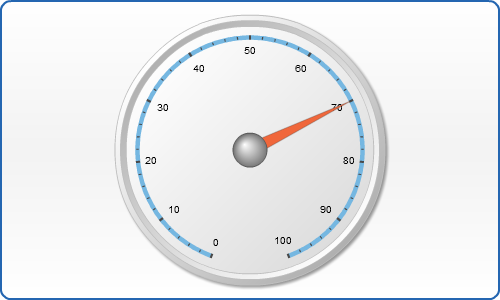
Sample chart using this external template, click to view live sample and XML settings:
Live Sample: External Template Gauge Sample
How to apply Template
The applying of the predefined templates is done in two ways. Whether you define your templates in main gauge node:
02 |
<gauge template="" circular_default_template="" linear_default_template="" image_default_template="" label_default_template="" /> |
Or you define templates for you circular gauge and your linear gauge separately:
03 |
<circular name="" template="" /> |
04 |
<linear name="" template="" /> |