Horizontal Gauge Color Range
Overview
Color ranges are used to color certain areas of the gauge to make it more informative. For example, you may split the scale into 3 areas: green, yellow and red according to their values. Size of color ranges is set in percents of the whole area and, therefore, color range can have different shapes. Each color_range node should be placed inside color_ranges node, and color_ranges must lie within axis node.
Typical XML settings for the ranges are:
03 |
<color_range start="0" end="10" start_size="50" end_size="50" padding="0" align="Center"> |
Color Ranges Parameters
The following attributes can be set for ranges:
| Attribute |
Values |
Default |
Description |
| start |
Number |
Auto |
Sets start of color range (value according to current axis scale) |
| end |
Number |
Auto |
Sets start of color range (value according to current axis scale) |
| start_size |
Number |
Auto |
Start size of range |
| end_size |
Number |
Auto |
End size of range |
| padding |
Number |
Auto |
The padding of ranges |
| align |
Inside | Outside | Center |
Center |
Sets the position of ranges |

Ranges boundaries
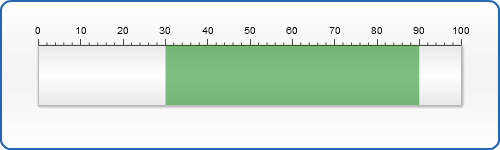
You can decide where to start you color range from and where end it. Let's, for example, draw one color range from values of 30 to 90.
02 |
<color_range start="30" end="90" color="green" /> |
In our sample it looks like this:
Live Sample: Sample horizontal Ranges Boundaries
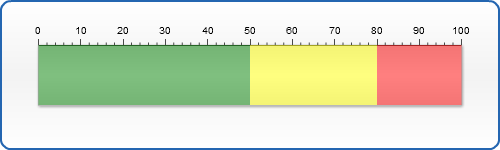
Coloring Ranges
You can set a color of your range using fill, hatch_fill, border, effects subnodes of color_range node. So let's use 3 colors (and respectively 3 ranges) to color our scale:
02 |
<color_range start="0" end="50" color="Green" /> |
03 |
<color_range start="50" end="80" color="Yellow" /> |
04 |
<color_range start="80" end="100" color="Red" /> |
Live Sample: Sample horizontal Ranges Coloring
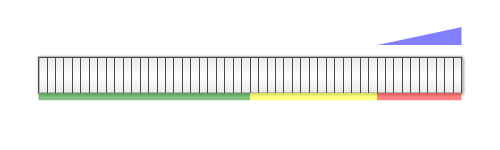
Positioning Ranges
You can set align of your color ranges using align and padding nodes and
also define start_size and end_size of your ranges (in goes in percents of gauge height).
For example we can set start_size to "100" and end_size to "%AxisSize*1". The last means that the height of our range
will have the same width as axis size. Or we set start_size to "%AxisSize*1" and
end_size to "%AxisSize*0.5".
Also the sizes of the can be totally presented in numbers,
without using "%AxisSize" keyword. start_size to "50", end_size to "30".
In the sample below we will show a sample Volume gauge, using color ranges to show different
sound levels and one range to show scale increase direction.
02 |
<color_range start="0" end="50" start_size="%AxisSize*0.2" end_size="%AxisSize*0.2" padding="0" align="Outside" color="Green" /> |
03 |
<color_range start="50" end="80" start_size="%AxisSize*0.2" end_size="%AxisSize*0.2" padding="0" align="Outside" color="Yellow" /> |
04 |
<color_range start="80" end="100" start_size="%AxisSize*0.2" end_size="%AxisSize*0.2" padding="0" align="Outside" color="red" /> |
05 |
<color_range start="80" end="100" start_size="0" end_size="15" padding="10" align="Inside" color="Blue" opacity="0.5" /> |
Live Sample: Sample horizontal Ranges Positioning
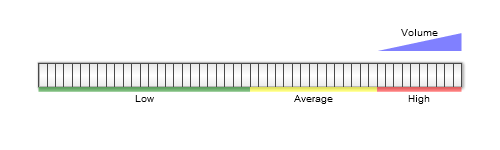
Labels
You can add labels that describe the range and adjust the position of these labels.
Just like for axis labels or tickmarks you can set align and padding for color ranges.
01 |
<color_range start="0" end="50" start_size="%AxisSize*0.2" end_size="%AxisSize*0.2" padding="0" align="Outside"> |
02 |
<fill enabled="true" type="Solid" color="green" opacity="0.5" /> |
03 |
<label enabled="true" align="Outside" padding="10"> |
04 |
<format><![CDATA[Good]]></format> |
In this sample we've added the descriptions to all color ranges in the gauge.
Live Sample: Sample horizontal Ranges Labels