Multiple Axes
Overview
You can have not a single axes but lots of. It is useful when you want your axes to have different orientation, have a various tickmarks step or more than one unit of measuring.

Adding multiple axes
When you want to add one or more additional axes it is obligatory that you create an extra_axes subnode that will hold all of your additional axes. Than you should create an node and use all the attributes that you used for your primary axis. The only difference is that every extra axis should have a unique name. Typical XML for extra axes look like this:
01 |
<?xml version="1.0" encoding="UTF-8"?> |
07 |
<axis name="additional_1" /> |
08 |
<axis name="additional 2" /> |
Sample of multiple axes usage
Here are some samples of multiple axes usage.
Thermometer sample
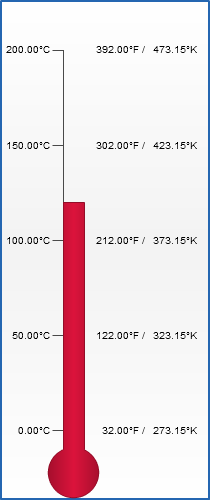
Let's create a thermometer that will show temperature by Celsius, Fahrenheit and Kelvin. Lets make the main axis show Celsius degrees. We need to define major_interval, minimum and maximum for the scale:
01 |
<scale minimum="0" maximum="200" major_interval="50" /> |
Then we change labels format so that they show Celsius(°C) degrees :
01 |
<labels enabled="true" align="Inside"> |
02 |
<format><![CDATA[{%Value}{numDecimals:2}°C]]></format> |
Now we create a Fahrenheit axis. We simply define axis name and adjust the position:
02 |
<axis name="Fahrenheit" position="60" /> |
Now we need to set scaling for our new axis. We know that 0°C is equal to 32°F. And that 50°C (our Celsius axis major_interval) is equal to 90°F. So after performing simple calculations we find out that our minimum must be "32", major_interval - "90", and maximum - "392". Also we need to start scaling from "32", not from zero. We use base_value attribute for it. So, the full XML for Fahrenheit extra axis is as follows:
01 |
<axis name="Fahrenheit" position="60" start_margin="10" end_margin="10"> |
02 |
<scale base_value="32" minimum="32" maximum="392" major_interval="90" /> |
03 |
<scale_bar enabled="false" /> |
04 |
<labels enabled="true" align="Inside"> |
05 |
<format><![CDATA[{%Value}{numDecimals:2}°F]]></format> |
07 |
<major_tickmark enabled="false" /> |
08 |
<minor_tickmark enabled="false" /> |
The XML settings for Kelvin axis are similar. The base_value and minimum in this case are "273.15", maximum - "473.15" and major_interval - "50":
01 |
<axis name="Kelvin" position="50" start_margin="10" end_margin="10"> |
02 |
<scale base_value="273.15" minimum="273.15" maximum="473.15" major_interval="50" /> |
03 |
<scale_bar enabled="false" /> |
04 |
<labels enabled="true" align="Inside"> |
05 |
<format><![CDATA[{%Value}{numDecimals:2}°K]]></format> |
07 |
<major_tickmark enabled="false" /> |
08 |
<minor_tickmark enabled="false" /> |
And finally we get a thermometer with 3 types of temperature measuring:
Live Sample: vertical multiple axes sample 1
Different pointers on axes examples
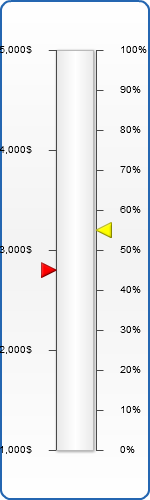
Let's create two different axes with pointers that belong to the certain axis. For the beginning let's configure the primary axis the following way:
01 |
<scale minimum="1000" maximum="5000" major_interval="1000" /> |
And set labels formatting so that they display "$" sign as suffix:
01 |
<labels enabled="true" rotate_circular="false" align="Inside" padding="15"> |
02 |
<format><![CDATA[{%Value}{numDecimals:0}$]]></format> |
Now we add additional axis that will be named the same way: "additional" and will be scaled in percents:
02 |
<axis name="additional" position="64" size="0" start_margin="10" end_margin="10"> |
03 |
<scale minimum="0" maximum="100" major_interval="10" /> |
04 |
<scale_line enabled="true" /> |
05 |
<scale_bar enabled="false" /> |
06 |
<labels enabled="true" align="Outside" padding="15"> |
07 |
<format><![CDATA[{%Value}{numDecimals:0}%]]></format> |
09 |
<major_tickmark enabled="true" align="Outside" padding="0" /> |
10 |
<minor_tickmark enabled="false" /> |
And as the final step we create two pointers. One of them will be attached to main axis, and another - to additional. XML for main pointer is:
01 |
<pointer type="marker" value="2800" color="red"> |
02 |
<marker_pointer_style shape="TriangleUp" align="Inside" width="15" height="15" padding="0" /> |
And for additional:
01 |
<pointer type="marker" value="55" color="Yellow" axis="additional"> |
02 |
<marker_pointer_style shape="TriangleUp" align="Outside" width="15" height="15" /> |
Note that we have added axis attribute to second pointer node and specified it: we wrote our additional axis name there. Now in the beginning both pointers show values of the appropriate axis. Then place both pointer nodes in pointers. The result is as follows:
Live Sample: vertical multiple axes sample 2