Circular Gauge Trendlines
Overview
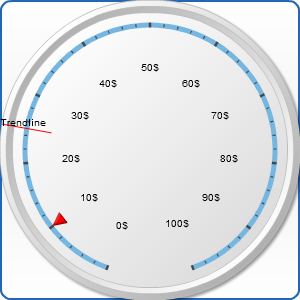
Trendline is like a custom tickmark which you can set on any spot of your axis. You may not only set it but also configure its visual appearance and set a custom label for it. Your trendline node must be a subnode of trendlines node, which is inside of axis.
![]()
Trendlines parameters
Trendlines has parameters similar to a simple tickmark. It has a size, value, padding and align node. Their meaning is obvious. Value defines the position of trendline on your axis and size - its height. Also you can adjust the position of your trendline with the help of align and padding nodes, which settings are similar to their settings in other nodes. Trendline also has some subnodes: label and line. Their attributes you can find in the Visual appearance chapter of AnyChart documentation. Here is a simple example of trendline usage:
![]()
![]()