Positioning
- Overview
- Coordinate System and Measure units
- Axis Radius and Axis Size
- Align
- Composite (Nested) Gauges
Overview
Positioning elements in a gauge may seem tricky at the first sight, but we believe that having studied this tutorial you have enough knowledge to understand how elements behave and what you should do to implement your own gauge.
This document talks about a single gauge, creation of several gauges in a single plot is possible and has some special thing you should know and understand. If you want to create a complex gauge, please study this document and you will find some notes about complex gauges in the end, and then study Complex (Composite) Gauges article.
![]()
Coordinate System and Measure units
Two things you should always keep in mind configuring gauge elements position or size are:
- Gauge is built in a coordinate system that starts in top left corner, where X goes from 0 to 100 left to right and Y goes from 0 to 100 top to bottom with no regard to actual pixel width and height.
- All sizes, positions and paddings are set in this coordinates.
Look at the illustration below to understand this clearly:
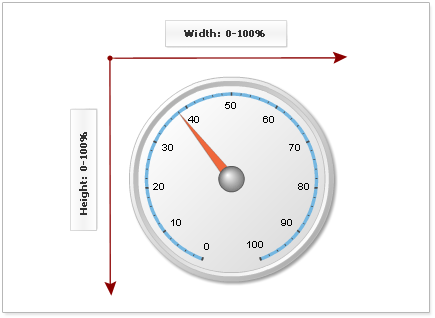
The fact that everything is set in percent allows you to resize your gauge very easy. Please refer to Resizing tutorial for more.
![]()
Axis Position and Axis Size
Another point if interest in positioning element is an Axis. Each gauge has one main axis for sure (and can have several).
You can't see Axis itself on a gauge - it's a set of different elements - scale, scale bar, labels, ranges, tickmarks, etc., but all this element belong to an axis and are positioned with regard of two axis parameters:
- Axis Size: <axis size=""/>
- Axis Radius: <axis radius=""/>
Axis Size defines a size of an imaginable bar that represent an axis (we will call it axis bar).
Axis Radius defines a size of an internal circular gauge.
An illustration below gives an understanding of both size and position:
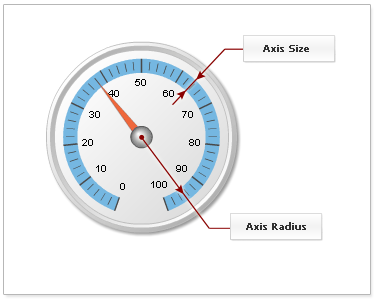
Axis size and radius affects aligns of all elements an a gauge: labels, tickmarks, pointers, color ranges, tickmarks, etc. Whenever you set: align="Inside" you set "Inside" of axis bar. Align are discussed in details later in this article.
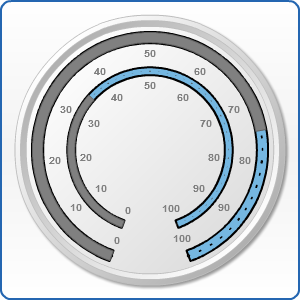
Please take a look at the sample below, this gauge has two axis with different radius and sizes, their scale bars have the same width with the axes, tickmarks are placed in"Center" and labels are placed "Inside". Sometimes this technique can be used to create several gauges in one.
![]()
%AxisSize keyword
When you configure elements placement with regard to Axis Size it is very useful to set, for example: scale bar should cover all axis size and tickmarks should be centered and cover a half of it. To avoid calculating this number yourself you can use %AxisSize keyword along with multiplication coefficients. The situation described above can be set as follows:

01 |
<axis size="50" radius="50"> |
02 |
<major_tickmark align="center" length="%AxisSize*0.5" /> |
03 |
<scale_bar size="%AxisSize" /> |
04 |
</axis> |
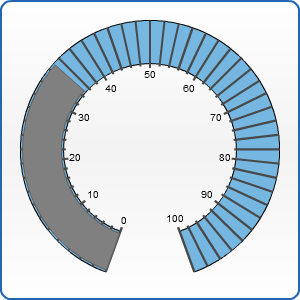
In the sample below %AxisSize is used to create a nice effect - tickmarks cross all scale bar and continue a little bit more.
![]()
Aligns
As it was said above, all gauge elements are aligned with regard to axis position and size, when you have several axes - all their nested elements are aligned with regard to the given axis position and size.
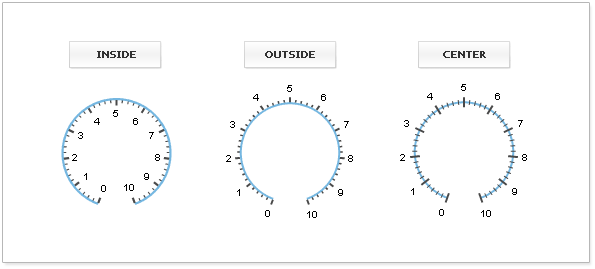
There are three align constant for all gauge types, but for each type this constants have their own meaning, for horizontally oriented linear gauges their meaning are:
- Inside: inside an axis bar.
- Center: centered to an axis position line.
- Outside: outside an axis bar.
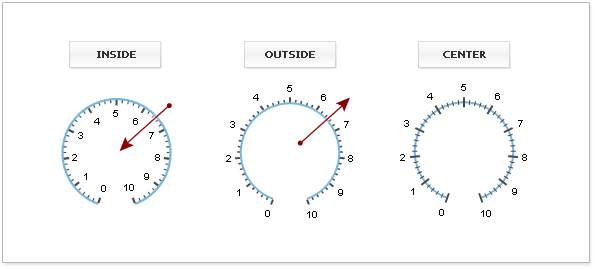
The picture below highlights align of the different element of a gauge:
![]()
Padding
When you align element you can move it away from the actual align position using padding attribute, padding is oriented and its negative or positive values depend on align. An illustration below shows the direction of the padding depending on align:
![]()
Composite (Nested) Gauges
With AnyChart you can create a complex composite gauges, for example circular gauge can contain several linear or circular gauges inside of it. Creation of composite gauges is described in Complex (Composite) Gauges and the only thing you should know about positioning of one gauge in the another is the fact that the width, height, x and y of children gauge are set in parent gauge coordinates.
![]()