TreeMap Chart
Overview
Treemaps display hierarchical (tree-structured) data as a set of nested rectangles. Each branch of the tree is given a rectangle, which is then tiled with smaller rectangles representing sub-branches. A leaf node's rectangle has an area proportional to a specified dimension on the data.
Often the leaf nodes are colored to show a separate dimension of the data.
When the color and size dimensions are correlated in some way with the tree structure, one can often easily see patterns that would be difficult to spot in other ways. A second advantage of treemaps is that, by construction, they make efficient use of space. As a result, they can legibly display thousands of items on the screen simultaneously.
Treemaps in AnyChart are build using a special plot_type named"TreeMap".
The illustration below shows structure of Treemap charts in AnyChart:
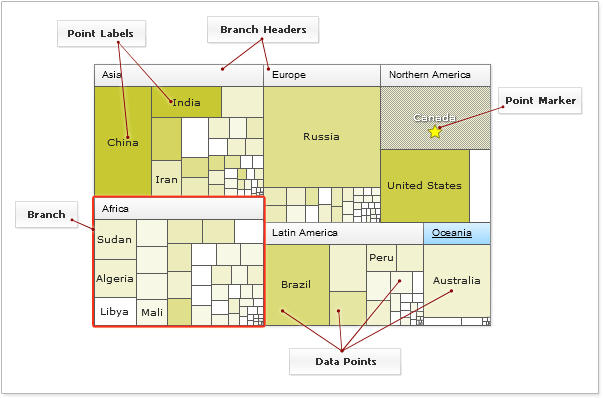

Chart-Building
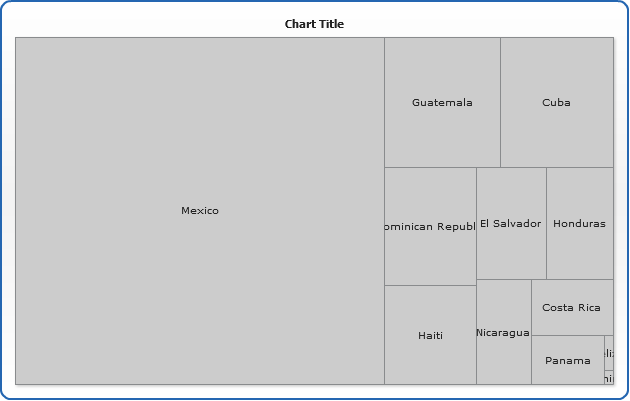
You can either visualize linear and hierarchical data using AnyChart treemaps, if, for example, you have the following data set listing countries population:
Linear Data
| Country |
Population |
| Belize |
219296 |
| Guatemala |
11277614 |
| Mexico |
95772462 |
| Costa Rica |
3463083 |
| Nicaragua |
4272352 |
| Panama |
2655094 |
| Cuba |
10951334 |
| Dominica |
82926 |
| Dominican Republic |
8088881 |
| Haiti |
6731539 |
| El Salvador |
5828987 |
| Honduras |
5605193 |
You can put it into AnyChart XML:
02 |
<point name="Belize" y="219296" /> |
03 |
<point name="Guatemala" y="11277614" /> |
04 |
<point name="Mexico" y="95772462" /> |
05 |
<point name="Costa Rica" y="3463083" /> |
06 |
<point name="Nicaragua" y="4272352" /> |
07 |
<point name="Panama" y="2655094" /> |
08 |
<point name="Cuba" y="10951334" /> |
09 |
<point name="Dominica" y="82926" /> |
10 |
<point name="Dominican Republic" y="8088881" /> |
11 |
<point name="Haiti" y="6731539" /> |
12 |
<point name="El Salvador" y="5828987" /> |
13 |
<point name="Honduras" y="5605193" /> |
And create a treemap:
Live Sample: Chart Building Using Linear Data
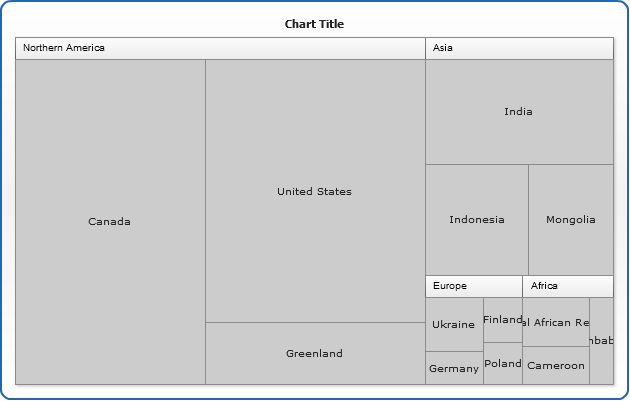
Hierarchical
Another case is when your data is a tree and data items are categorized - every country is located on some continent:
| Continent |
Country |
Area |
| Northern America |
Canada |
9976140 |
| United States |
9372610 |
| Greenland |
2175600 |
| Africa |
Central African Republic |
622980 |
| Cameroon |
475440 |
| Zimbabwe |
390580 |
| Asia |
Indonesia |
1919440 |
| Mongolia |
1565000 |
| India |
3287590 |
| Europe |
Finland |
337030 |
| Ukraine |
603700 |
| Poland |
312683 |
| Germany |
356910 |
This data should be put into the XML shown below:
01 |
<data input_mode="ByTree"> |
02 |
<point name="Northern America"> |
03 |
<point name="Canada" y="9976140" /> |
04 |
<point name="United States" y="9372610" /> |
05 |
<point name="Greenland" y="2175600" /> |
08 |
<point name="Central African Republic" y="622980" /> |
09 |
<point name="Cameroon" y="475440" /> |
10 |
<point name="Zimbabwe" y="Zimbabwe" /> |
13 |
<point name="Indonesia" y="1919440" /> |
14 |
<point name="Mongolia" y="1565000" /> |
15 |
<point name="India" y="3287590" /> |
18 |
<point name="Finland" y="337030" /> |
19 |
<point name="Ukraine" y="603700" /> |
20 |
<point name="Poland" y="312683" /> |
21 |
<point name="Germany" y="356910" /> |
Which can be later shown like that :
Live Sample: Chart Building Using Hierarchical Data
Tree Input Format
You have three option for definition of hierarchical data: tree, parent-child and levels. This format should be set in input_mode attribute of <data> node. <data> node itself is a data point container and contains direct descendants,. The value of container nodes (not leafs) is calculated as a sum of all its descendants.
Tree
Tree based input is default and hierarchy is defined by XML hierarchy within <data> node. For example:
01 |
<data input_mode="bytree"> |
Parent
Another way to define hierarchy is referencing each item to its parent - in AnyChart XML it is set in parent attribute. This method for storing trees is widely used in relational databases and AnyChart allows you to put plain tables from databases into XML easily. There is no need to define parent before its children.
The only limitation implied: id of each point should start from latin letter (A-Za-z) or underscore (_) and should contain only latin letters, numbers and underscores. If parent is not set or there is no node with parent defined - the root node is considered as parent.
01 |
<data input_mode="byparent"> |
02 |
<point id="p_2" parent="p_1" /> |
04 |
<point y="310" parent="p_2" /> |
05 |
<point y="290" parent="p_2" /> |
06 |
<point id="p_3" parent="p_1" /> |
07 |
<point y="60" parent="p_3" /> |
08 |
<point y="150" parent="p_3" /> |
10 |
<point y="100" parent="p_4" /> |
11 |
<point y="100" parent="p_4" /> |
12 |
<point y="100" parent="p_4" /> |
13 |
<point y="100" parent="p_4" /> |
Level
And the third way to define the structure is to define nesting level. Level can be any number, even non-integer or negative. Nesting levels should not come in order. If level is not set it gets the default level ="0".
01 |
<data input_mode="bylevel"> |
04 |
<point y="310" level="2" /> |
05 |
<point y="290" level="2" /> |
07 |
<point y="60" level="2" /> |
08 |
<point y="150" level="2" /> |
10 |
<point y="100" level="2" /> |
11 |
<point y="100" level="2" /> |
12 |
<point y="100" level="2" /> |
13 |
<point y="100" level="2" /> |
14 |
<point y="300" level="0" /> |
Custom Data Attributes
You can attach any custom data to any point in the tree and use it to show in labels or tooltips
XML syntax for custom attributes is the following:
01 |
<data input_mode="ByTree"> |
02 |
<point name="Europe" threshold="autoTr"> |
03 |
<point name="Albania" y="28750"> |
05 |
<attribute name="Code"><![CDATA[AL]]></attribute> |
06 |
<attribute name="Country"><![CDATA[Europe]]></attribute> |
07 |
<attribute name="Region"><![CDATA[Southern Europe]]></attribute> |
08 |
<attribute name="Population"><![CDATA[3249136]]></attribute> |
11 |
<point name="Greece" y="131940"> |
13 |
<attribute name="Code"><![CDATA[GR]]></attribute> |
14 |
<attribute name="Country"><![CDATA[Europe]]></attribute> |
15 |
<attribute name="Region"><![CDATA[Southern Europe]]></attribute> |
16 |
<attribute name="Population"><![CDATA[10538594]]></attribute> |
19 |
<point name="Macedonia" y="25333"> |
21 |
<attribute name="Code"><![CDATA[MK]]></attribute> |
22 |
<attribute name="Country"><![CDATA[Europe]]></attribute> |
23 |
<attribute name="Region"><![CDATA[Southern Europe]]></attribute> |
24 |
<attribute name="Population"><![CDATA[2104035]]></attribute> |
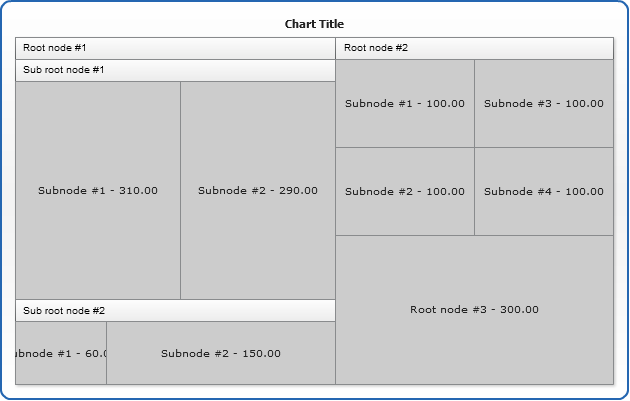
Data Input Summary
Here we want to say that all three sample settings cut above will result in the same tree:
Live Sample: TreeMap data input modes sample
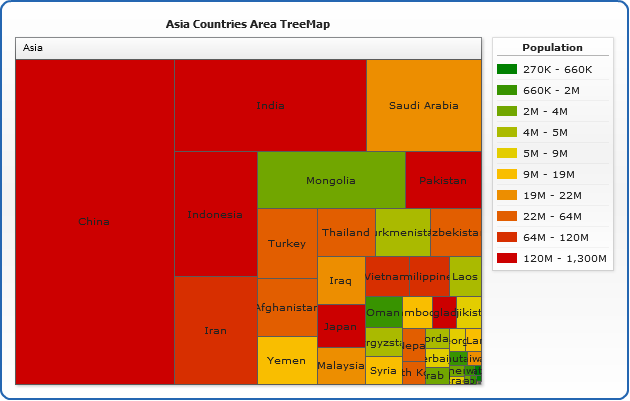
And you can use custom attributes along with thresholds values to define auto-coloring:
03 |
<threshold name="autoTr" type="Quantiles" auto_value="{%Pop}" range_count="10" palette="myPalette" /> |
05 |
<data input_mode="ByTree" threshold="autoTr"> |
07 |
<point name="Turkey" y="780580"> |
09 |
<attribute name="Cd"><![CDATA[TR]]></attribute> |
10 |
<attribute name="Cnt"><![CDATA[Asia]]></attribute> |
11 |
<attribute name="Rg"><![CDATA[Western Asia]]></attribute> |
12 |
<attribute name="Pop"><![CDATA[62484478]]></attribute> |
13 |
<attribute name="Pg"><![CDATA[1.67]]></attribute> |
14 |
<attribute name="Im"><![CDATA[43.2]]></attribute> |
15 |
<attribute name="Gdp"><![CDATA[345700]]></attribute> |
16 |
<attribute name="Inf"><![CDATA[94]]></attribute> |
Live sample of the colored tree:
Live Sample: Big TreeMap thresholds sample
Styles and Customization
There are several special things about treemap charts.
Branches
First of all there is a special <branch> node in style that defines how tree branches are shown, you can define <inside_margin>, <outside_margin>, <background> and <header> for them - so user can easily distinguish them among other elements.
Sorting
<tree_map> node has sort attribute, which defines how sub-nodes of each branch are sorted. It can be "asc", "desc" - default, and "none" - you will get "as they go" in XML file order.
Drilldown
<tree_map> node has enable_drilldown attribute which can be "true" or "false". It defines whether branches will expand their content on all chart when they are clicked, or not.
Labels text display
Although treemaps give a great opportunity to show a lot of data in a limited space, you can't always place all texts on the chart. drawing_mode attribute of <label_settings> node in Treemaps defines how branches headers and data item labels are displayed.
It can be "display_all" - all labels are shown with no regard to overlap, "hide" - if text doesn't fit it wouldn't be displayed at all, and "crop" - the default value that cuts text by the item borders.
02 |
<tree_map sort="asc|desc|none"> |
05 |
<background enabled="true"> |
06 |
<border enabled="true" /> |
07 |
<fill enabled="true" /> |
09 |
<inside_margin all="0" top="-1" /> |
10 |
<outside_margin all="0" bottom="20" /> |
11 |
<header enabled="true" align="Near"> |
12 |
<text><![CDATA[{%Name}]]></text> |
13 |
<background enabled="true"> |
14 |
<inside_margin all="0" left="6" top="2" /> |
Branches headers settings
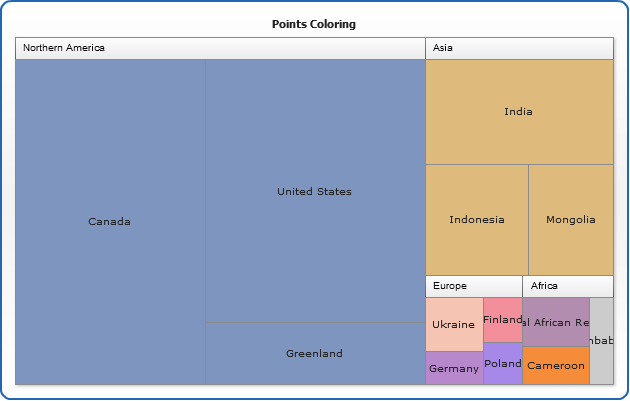
Coloring a tree
Live sample :
Live Sample: TreeMap - Points Coloring
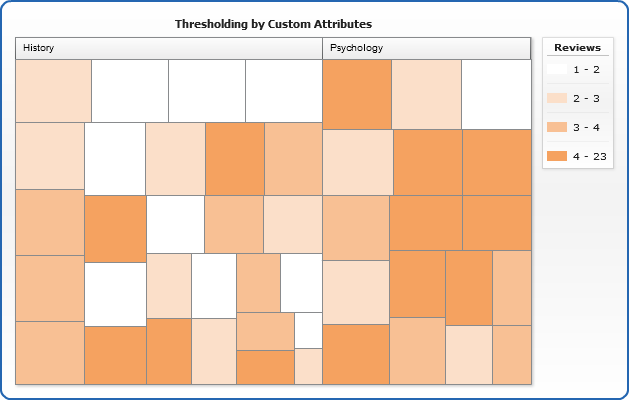
Using thresholds
Live sample - custom attributes values are used to color the tree according to threshold settings:
Live Sample: TreeMap - Thresholding by Custom Attributes
Labels
Sample treemap with labels configured :
Live Sample: TreeMap - Using Labels
Tooltips
Sample treemap with tooltips configured:
Live Sample: TreeMap - Using Tooltips
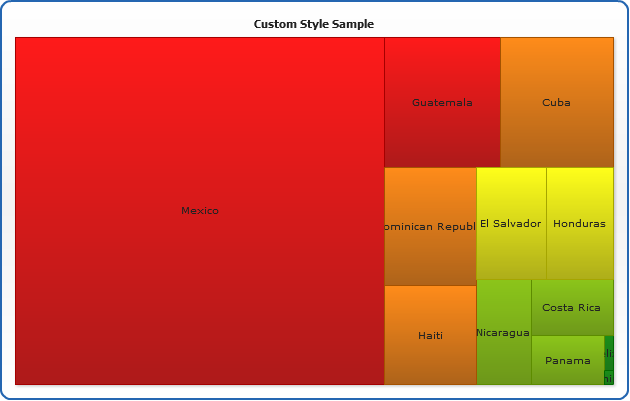
Tree Items Style
Live sample of styles tree items:
Live Sample: TreeMap - Using Styles
Using multiple Labels, Markers and Tooltips
coming soon