Funnel and Pyramid Charts
Overview
Funnel charts are so-called Accumulation charts and they show percentage ratio. Funnel charts are often used to represent stages in a sales process and show the amount of potential revenue for each stage.
This type of chart can also be useful in identifying potential problem areas in an organization’s sales processes. A funnel chart is similar
to a stacked percent bar chart.
Chart Building
To create Funnel chart with AnyChart you have to set plot_type="Funnel" in <chart>.
Single-Series Funnel Chart
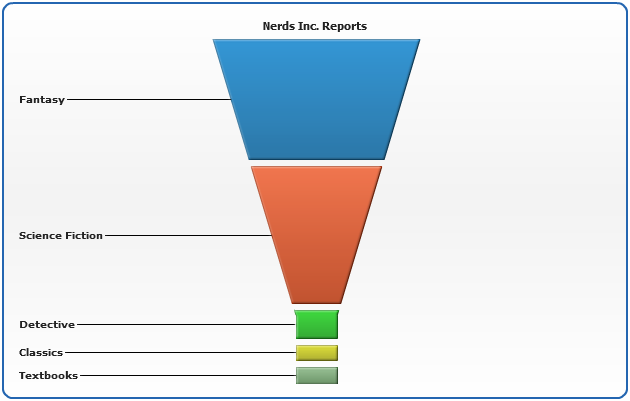
Let's take a look at the sample data set that shows the number of different genres sold in local bookstore «Nerds Inc.» in 2005.
| Genre |
Quantity |
| Fantasy |
637166 |
| Science Fiction |
721630 |
| Detective |
148662 |
| Classics |
78662 |
| Textbooks |
90000 |
To put this data into XML we set:
02 |
<series name="Year 2005"> |
03 |
<point name="Fantasy" y="637166" /> |
04 |
<point name="Science Fiction" y="721630" /> |
05 |
<point name="Detective" y="148662" /> |
06 |
<point name="Classics" y="78662" /> |
07 |
<point name="Textbooks" y="90000" /> |
This data will look like that in Funnel chart:
Live Sample: Sample Single-Series Funnel Chart 1
Funnel Series Properties
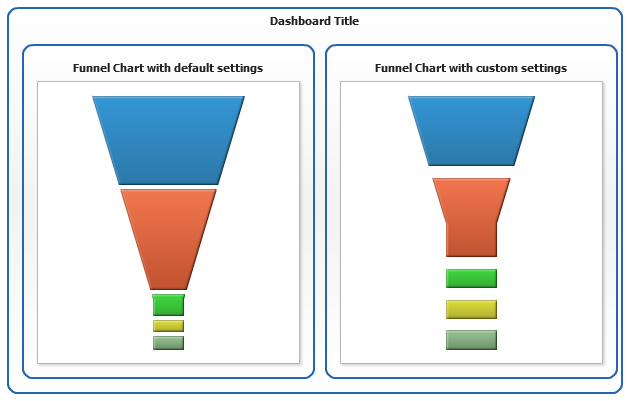
You can tune how funnel looks like using sub nodes and attributes of <funnel_series>:
- neck_height - the height of the neck - vertical part of funnel, is set as a ratio from 0 to 1 (percentage of full funnel height).
- min_width - minimal width of neck, is set as a ratio from 0 to 1 (percentage of full funnel width).
- padding - the padding between funnel parts, is set as a ratio from 0 to 1 (percentage of full funnel height).
- min_point_size - minimal point size, is set as a ratio from 0 to 1 (percentage of full funnel height).
- fit_aspect - the ratio between width and height of funnel, used to tune layout.
- inverted - used to invert the funnel.
01 |
<funnel_series neck_height="0.5" min_width="0.4" padding="0.05" min_point_size="0.1" fit_aspect="0.5" inverted="false" /> |
Live sample of settings applied:
Live Sample: Sample Single-Series Funnel Chart 2
3D Funnel
To show Funnel as 3D shape set enable_3d_mode="true" in <data_plot_settings>:
01 |
<data_plot_settings enable_3d_mode="true" /> |
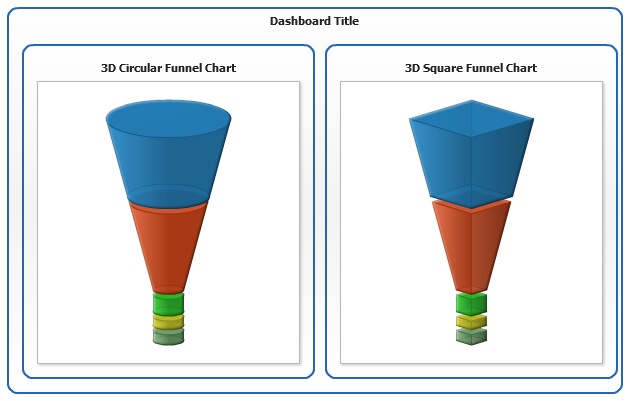
3D Funnel Series Properties
3D funnel has all settings of flat funnel and some special options:
- depth_3d - sets the depth of 3D perspective (from 0 to 1)
- mode - sets the shape of 3D Funnel: "circular" or "square".
01 |
<funnel_series depth_3d="0.3" mode="square" /> |
Live sample of setting applied:
Live Sample: Sample Single-Series Funnel Chart 3
Cone and Pyramid
You can turn your funnel into Cone or Pyramid you should just set neck_height and min_width to "0" and set mode="circular" - to get Conical shape, or mode="square" - to show Pyramid
01 |
<funnel_series neck_height="0" min_width="0" mode="square" /> |
Live sample of settings applied:
Live Sample: Sample Single-Series Funnel Chart 4
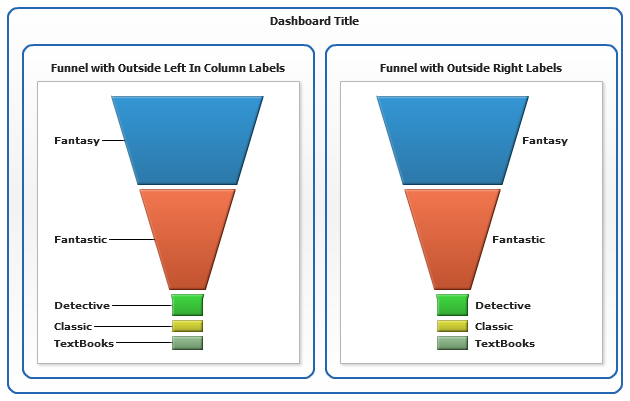
Labels
Labels make funnel really readable and slick. If you want to show labels - use <label_settings> in <funnel_series>. Labels can be shown inside and outside of items, to set labels placement use placement_mode attribute of <label_settings> node. Its possible values are:
- inside - inside of data point.
- outsideLeft - to the left of the point.
- outsideRight - to the right of the paint.
- outsideLeftInColumn - to the left, in column.
- outsideRightInColumn - to the right, in column.
02 |
<label_settings enabled="true" placement_mode="outsideLeftIncolumn"> |
03 |
<format><![CDATA[{%Name}]]></format> |
Live sample of label placement:
Live Sample: Sample Single-Series Funnel Chart 5