Dashboard Layout System
Overview
AnyChart Layout System created in a way that allows to place any element anywhere and, at the same time, avoid the necessity of setting absolute coordinates.

What is View
To start building and understanding layout we should, at first, understand what is view. View is a basic block of dashboard, all views have a type and margins.
Small note about margins, widths and heights:
Margins
<margin> node defines outer margins of a view content, you can set all margins using all attribute, or certain margins using left, right, top and bottom attributes, any of the last four override all value. Typical margin settings are:
01 |
<margin all="10" left="0" right="0" /> |
Width and Height
width and height attributes (where applicable) define a height and width of view content, they can be set in pixels or percents, if set in percents - these are percents of a view parent node (<view type="Dashboard">, <view type="Panel">, <hbox> or <vbox> ) width or height.
View types
type attribute defines what attributes and nodes can be used in a view, and how it behaves in dashboard.
There are following types of views:
1) Dashboard
The main (top level, right inside <dashboard> node) view of any Dashboard should be of this type, this type of view has <background>, <title> and <margin>, typical settings for this view:
02 |
<view type="Dashboard"> |
05 |
<text><![CDATA[Dashboard Sample Title]]></text> |
07 |
<background enabled="true"> |
08 |
<border enabled="true" /> |
2) Panel
"Panel" view type is almost the same as dashboard - it acts as a container for other elements, it has <background>, <title>, <margin>, width and height. It should be within, at least, <view type="Dashboard"> (or <hbox>, or <vbox>, or another <view type="Panel"/>). Typical settings for this view:
04 |
<text><![CDATA[Dashboard Panel Title]]></text> |
06 |
<background enabled="true"> |
07 |
<border enabled="true" /> |
3) Chart
View of "Chart" type acts as a container for chart, it has name, source_mode, source, width, height and <margins>. It should be within, at least, <view type="Dashboard"> (or <hbox>, or <vbox>, or <view type="Panel">). Typical settings for this view:
01 |
<view type="Chart" name="ViewName" source_mode="externalData" source="chart.xml" width="100%" height="100%"> |
Attributes description:
| Attribute |
Values |
Description |
| name |
String |
Unique view identifier, used in actions to update view content. |
| source_mode |
Enum:
externalData
internalData |
Source mode defines whether chart for view is taken by identifier within chart XML, or by file name. |
| source |
String |
Chart name in case of "internalData" mode, and file name in case of "externalData". |
What are hbox and vbox
<hbox> and <vbox> are the containers, that organize all their content into the horizontal row or vertical column, accordingly. They have <margin>, width and height, they can contain <view type="Panel">, <view type="Chart">, <hbox> and <vbox>.
Typical settings for them:
<hbox>:
01 |
<hbox width="100%" height="100%"> |
03 |
<chart type="Chart" width="50%" height="100%" name="Chart 1" source_mode="externalData" source="chart1.xml" /> |
04 |
<chart type="Chart" width="25%" height="100%" name="Chart 2" source_mode="externalData" source="chart2.xml" /> |
05 |
<chart type="Chart" width="25%" height="100%" name="Chart 3" source_mode="externalData" source="chart3.xml" /> |
<vbox>:
01 |
<vbox width="100%" height="100%"> |
03 |
<chart type="Chart" width="100%" height="33.3%" name="Chart 1" source_mode="externalData" source="chart1.xml" /> |
04 |
<chart type="Chart" width="100%" height="33.3%" name="Chart 2" source_mode="externalData" source="chart2.xml" /> |
05 |
<chart type="Chart" width="100%" height="33.3%" name="Chart 3" source_mode="externalData" source="chart3.xml" /> |
How to built a desired layout
To build a desired layout you should imagine it and (recommended) draw on a sheet of paper (or in some image editor, if you like), then find rows and columns in your layout and convert them into <hbox> and <vbox> containers.
Lets look at a simple example, we want to create a dashboard layout like that:
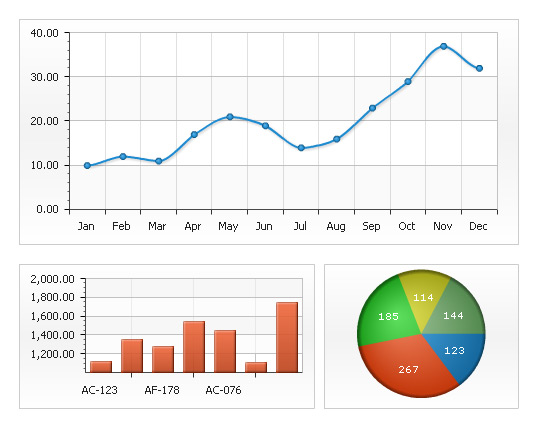
Lets find rows and columns along with widths and heights:
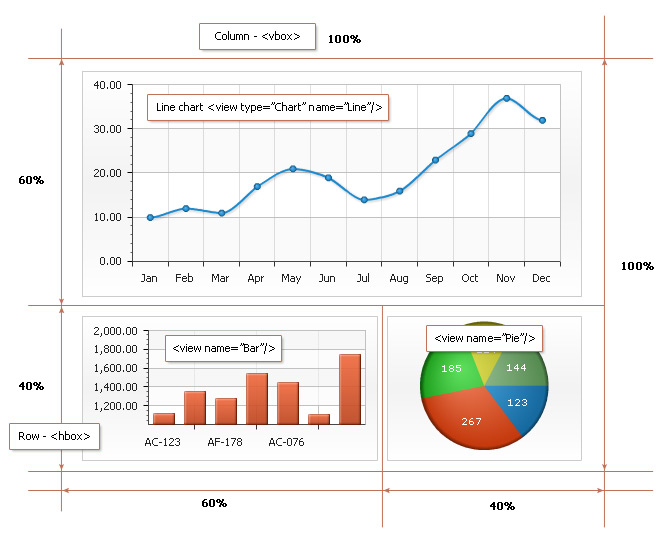
Now simply convert this to layout:
02 |
<view type="Dashboard"> |
03 |
<vbox width="100%" height="100%"> |
04 |
<view type="Chart" name="Line" width="100%" height="60%" /> |
05 |
<hbox width="100%" height="40%"> |
06 |
<view type="Chart" name="Bar" width="60%" height="100%" /> |
07 |
<view type="Chart" name="Pie" width="40%" height="100%" /> |
Done. The layout is ready, now you can tune it using margins, backgrounds and titles. In the next chapter we have prepared several typical layouts - just copy them and modify (if needed) to build your own dashboards.
Layout Templates
Below you will find typical Layout Templates, use them a starting point of creation of your own layout.
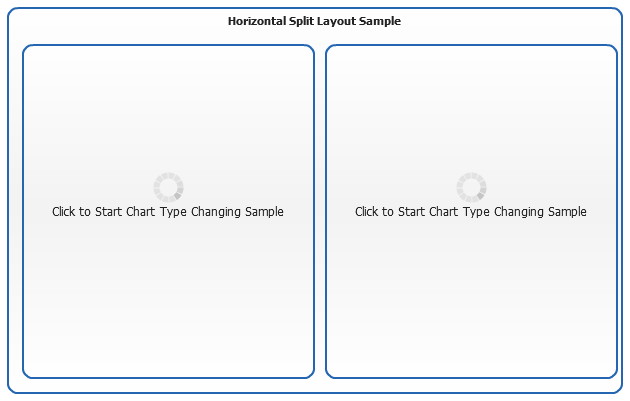
Horizontal Split
Horizontal Split is a basic and easiest layout. Just use <hbox> to split dashboard in one column, you can add as many elements to <hbox> as you need - they will go one by one in a single column - don't forget to specify heights of elements within <hbox>. Dashboard XML Settings for Horizontal Split:
01 |
<?xml version="1.0" encoding="UTF-8"?> |
04 |
<view type="Dashboard"> |
05 |
<hbox height="100%" width="100%"> |
06 |
<view type="chart" source="chart1" height="100%" width="50%" /> |
07 |
<view type="chart" source="chart2" height="100%" width="50%" /> |
Live Horizontal Split Layout Sample:
Live Sample: Dashboard Layout - Horizontal Split
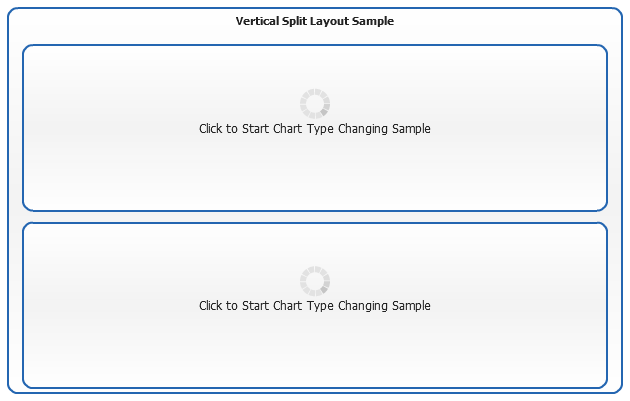
Vertical split
Vertical Split is just the same as horizontal, but uses <vbox> to arrange items into a single row. Dashboard XML Settings for Vertical Split:
01 |
<?xml version="1.0" encoding="UTF-8"?> |
04 |
<view type="Dashboard"> |
05 |
<vbox height="100%" width="100%"> |
06 |
<view type="chart" source="chart1" height="50%" width="100%" /> |
07 |
<view type="chart" source="chart2" height="50%" width="100%" /> |
Live Vertical Split Layout Sample:
Live Sample: Dashboard Layout - Vertical Split
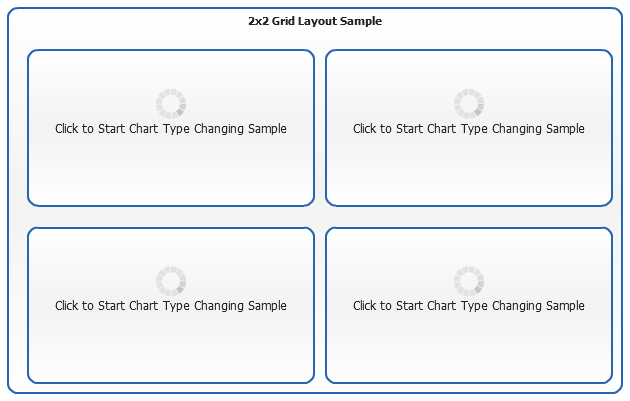
2x2 Grid
To built 2x2 Grid layout you have to use combination of one <hbox> and two <vbox> nodes (or vice versa - one <vbox> and two <hbox> nodes), just as shown below:
01 |
<?xml version="1.0" encoding="UTF-8"?> |
04 |
<view type="Dashboard"> |
05 |
<vbox height="100%" width="100%"> |
06 |
<hbox height="50%" width="100%"> |
07 |
<view type="chart" source="chart1" height="100%" width="50%" /> |
08 |
<view type="chart" source="chart2" height="100%" width="50%" /> |
10 |
<hbox height="50%" width="100%"> |
11 |
<view type="chart" source="chart3" height="100%" width="50%" /> |
12 |
<view type="chart" source="chart4" height="100%" width="50%" /> |
Live 2x2 Grid Layout Sample:
Live Sample: Dashboard Layout - 2x2 Grid
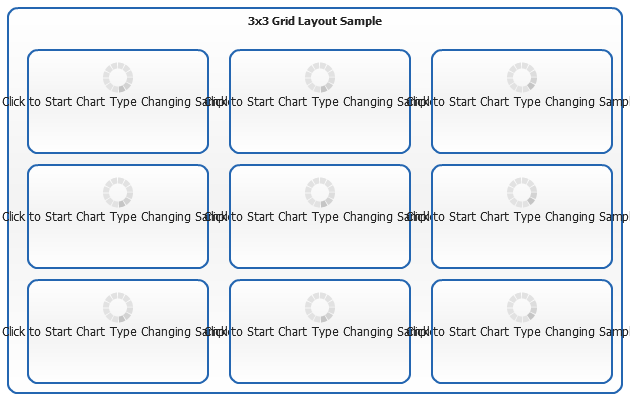
3x3 Grid
To built 3x3 Grid layout you have to use just the same technique as 2x2 grid, but combination of one <hbox> and three <vbox> nodes (or vice versa - one <vbox> and three <hbox> nodes), just as shown below:
01 |
<?xml version="1.0" encoding="UTF-8"?> |
04 |
<view type="Dashboard"> |
05 |
<hbox height="100%" width="100%"> |
06 |
<vbox height="100%" width="33.33%"> |
07 |
<view type="chart" source="chart1" height="33.33%" width="100%" /> |
08 |
<view type="chart" source="chart2" height="33.33%" width="100%" /> |
09 |
<view type="chart" source="chart3" height="33.33%" width="100%" /> |
11 |
<vbox height="100%" width="33.33%"> |
12 |
<view type="chart" source="chart1" height="33.33%" width="100%" /> |
13 |
<view type="chart" source="chart2" height="33.33%" width="100%" /> |
14 |
<view type="chart" source="chart3" height="33.33%" width="100%" /> |
16 |
<vbox height="100%" width="33.33%"> |
17 |
<view type="chart" source="chart1" height="33.33%" width="100%" /> |
18 |
<view type="chart" source="chart2" height="33.33%" width="100%" /> |
19 |
<view type="chart" source="chart3" height="33.33%" width="100%" /> |
Live 3x3 Grid Layout Sample:
Live Sample: Dashboard Layout - 3x3 Grid
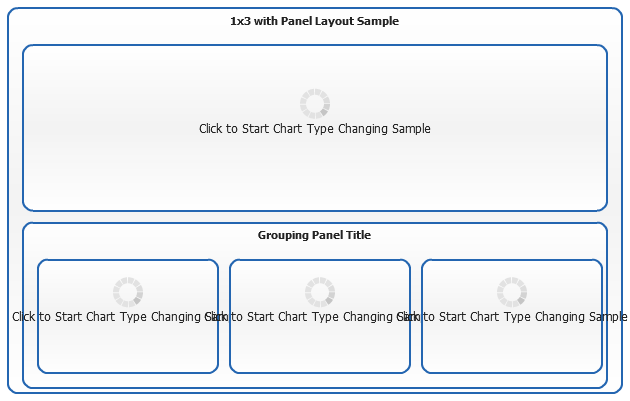
1x3 Vertical with Panel
1x3 Vertical with Panel layout is very useful when you want to create one big main chart at the top of the dashboard and some additional charts at the bottom grouped under single title. XML Setting for this layout are:
01 |
<?xml version="1.0" encoding="UTF-8"?> |
04 |
<view type="Dashboard"> |
05 |
<vbox height="100%" width="100%"> |
06 |
<view type="chart" source="chart1" height="50%" width="100%" /> |
07 |
<hbox height="50%" width="100%%"> |
08 |
<view type="Panel" width="100%" height="100%"> |
10 |
<text><![CDATA[Grouping Title]]></text> |
12 |
<view type="chart" source="chart1" width="33.33%" height="100%" /> |
13 |
<view type="chart" source="chart2" width="33.33%" height="100%" /> |
14 |
<view type="chart" source="chart3" width="33.33%" height="100%" /> |
Live 1x3 with Panel Layout Sample:
Live Sample: Dashboard Layout - 1x3 Vertical with Panel